41 lessons, six modules
Some claims survive the count. Many do not, and the videos say which is which. The course runs in order — foundations, range, levels, risk, setups, and your own system — and ends with the ten claims that survived.
41 lessons · 7 hours of video · 33 calculations published · free, no sign-up
1 · Foundations
Why a win rate on its own decides nothing, what a market actually is, what four numbers on a bar do and do not contain, the three orders you need, and what a trade costs before price has moved at all. Measured on real data, including the chart readings that turn out to be worth nothing.
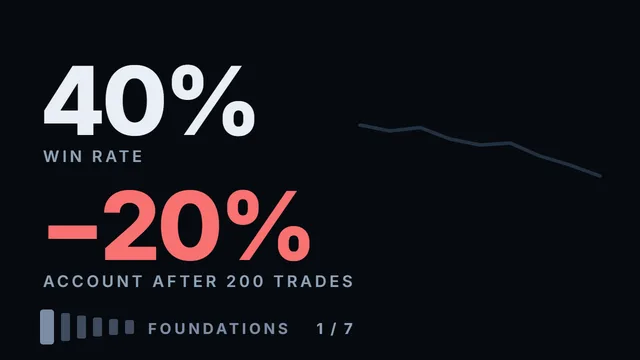 Foundations · 1 of 7 · 12 minWhy a 40% Win Rate Can Still Lose MoneyYour win rate says how often you were right.
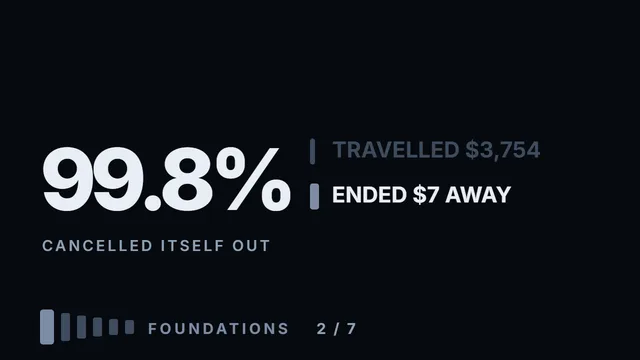 Foundations · 2 of 7 · 10 minWho Actually Moves Price calculationOver 250 sessions Tesla travelled $3,754 and finished $7 from where it started.
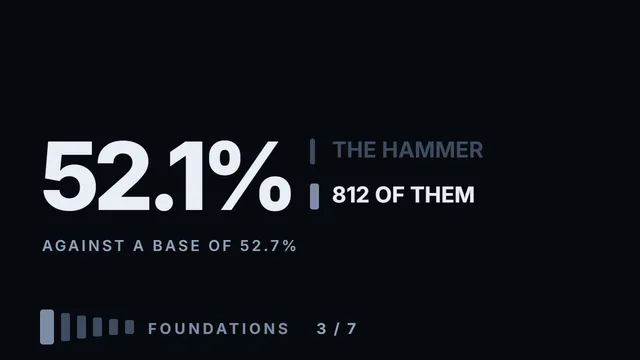 Foundations · 3 of 7 · 10 minHow to Read a Price Chart calculationA bar on a chart is four numbers: where the day opened, the highest it reached, the lowest, and where it closed.
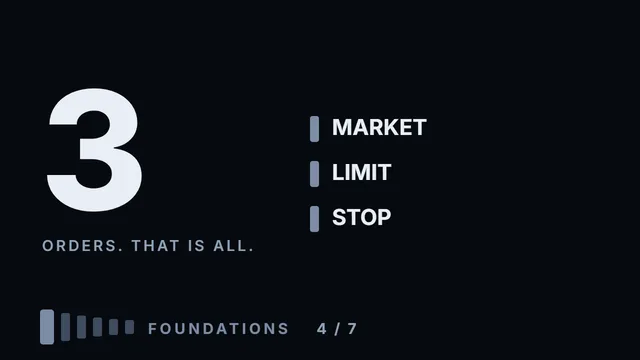 Foundations · 4 of 7 · 11 minMarket, Limit, Stop - The Only Three Orders You NeedYour platform offers a dozen order types.
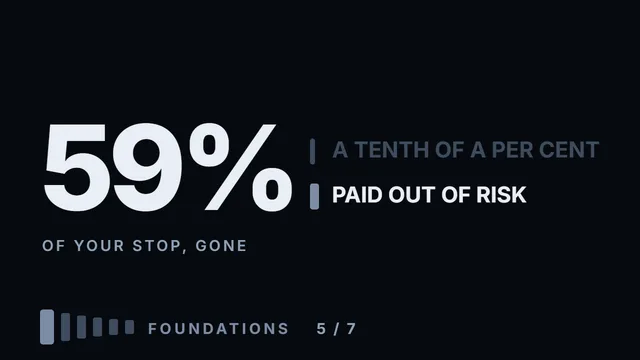 Foundations · 5 of 7 · 11 minWhat a Trade Really Costs calculationCosts are quoted as a percentage of the amount you traded.
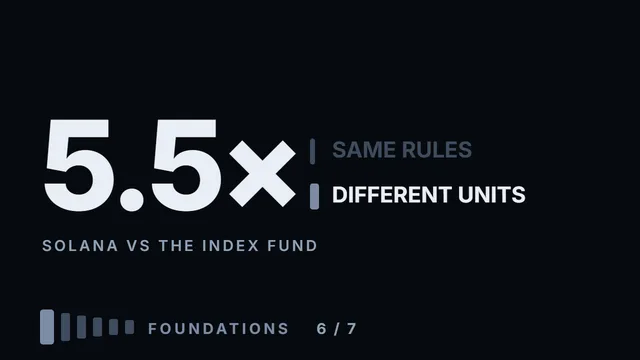 Foundations · 6 of 7 · 11 minStocks vs Crypto: What Changes, What Doesn't calculationSix instruments — three stocks and three coins — asked the same seven questions.
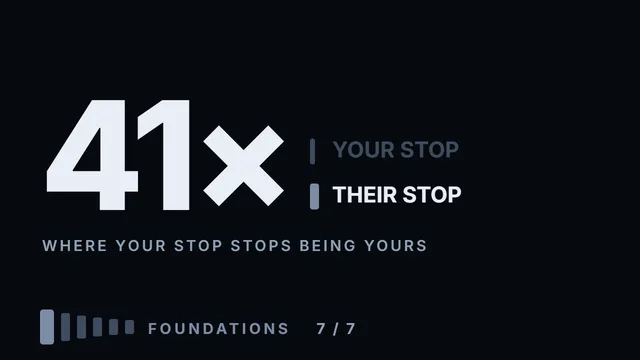 Foundations · 7 of 7 · 12 minLeverage and Margin: How Accounts Blow Up calculationLeverage does not multiply your profit.
2 · Range
How far an instrument usually travels, how much room is left to the next level, and how much of the day is still ahead. The claim that price covers one ATR eighty per cent of the time is counted here: under the natural reading it comes out at 41 per cent.
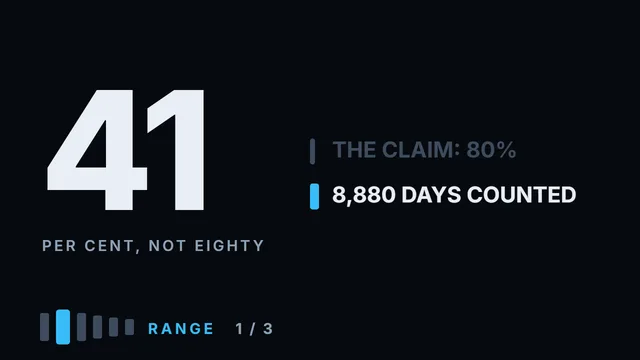 Range · 1 of 3 · 14 minHow Far It Moves, and Why Two Measures Disagree calculationEighty per cent of the time, an instrument travels one ATR.
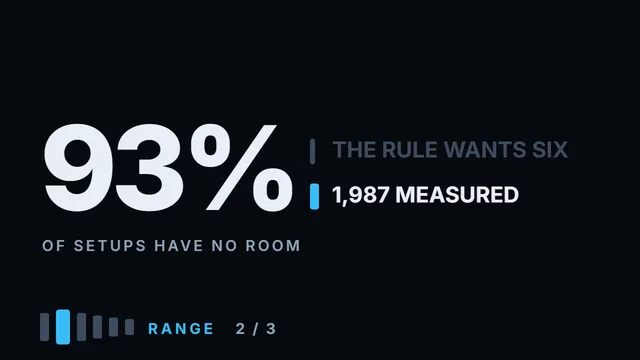 Range · 2 of 3 · 12 minThe Two Kinds of Room calculationTwo questions decide whether an entry is worth taking: how far price can go from here, and how much of the day is left.
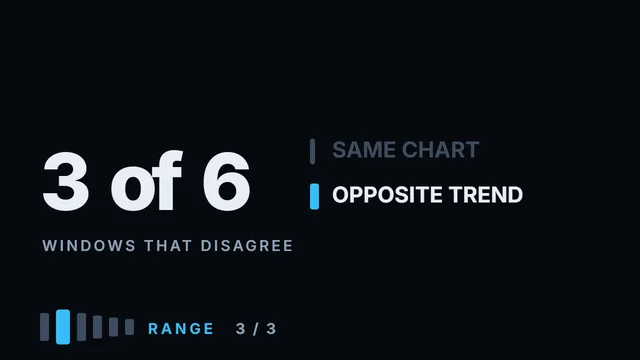 Range · 3 of 3 · 11 minMeasuring a Channel calculationDraw a channel on any chart and it will look right.
3 · Levels
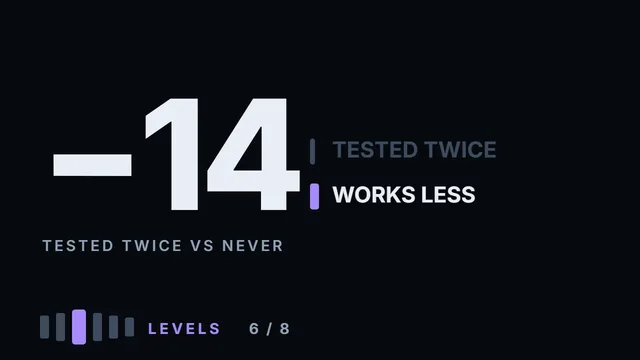
Where a line on a chart comes from, what makes one worth trading, and how to mark up a blank chart by rule instead of by taste. Several popular criteria are counted here, most of them measure nothing, and a level price has already tested holds a little less often than a fresh one, not more.
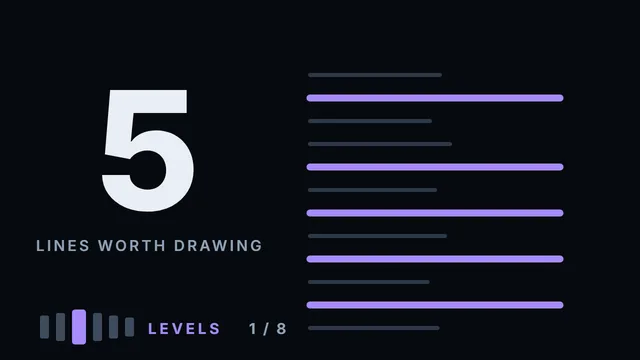 Levels · 1 of 8 · 11 minWhat a Level Actually IsA line on a chart is not a feature of the market.
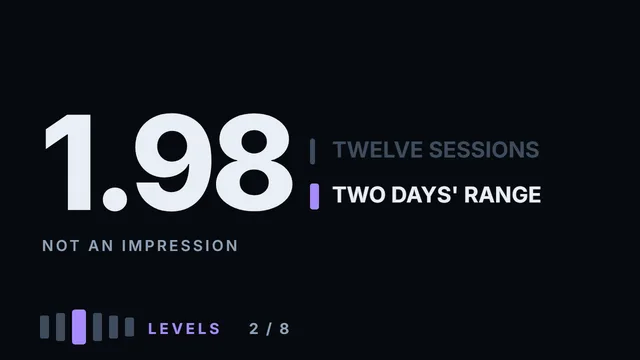 Levels · 2 of 8 · 10 minLevels From Consolidation calculationTwenty candles that go nowhere.
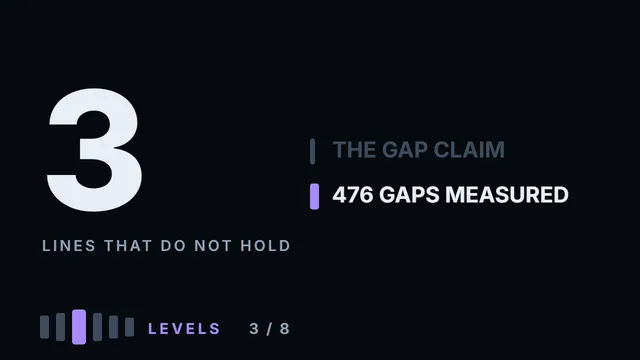 Levels · 3 of 8 · 14 minLevels From Gaps calculationThere is a hole in the chart: yesterday's close, this morning's open, and no trades in between.
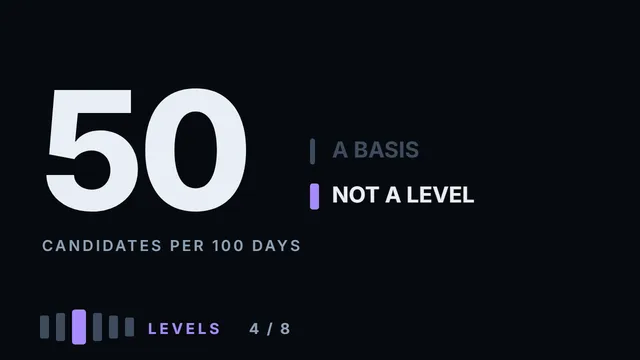 Levels · 4 of 8 · 12 minLevels From Turns and Wide-Range Bars calculationThere are two places almost everybody draws a level: the extreme of a turn, and the edge of an unusually big bar.
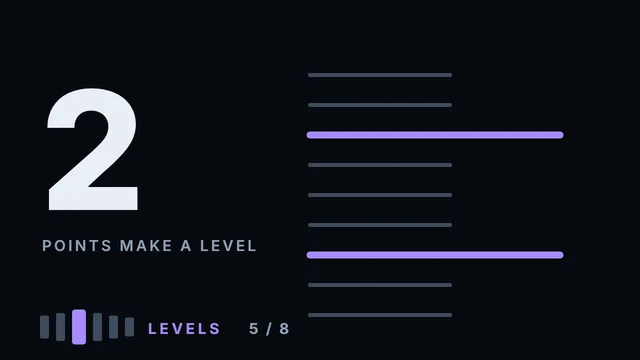 Levels · 5 of 8 · 11 minOrigin and Confirmation calculationOne clean touch and a sharp reaction is a candidate, not a level.
 Levels · 6 of 8 · 11 minRanking Levels: Which One Do You Trade? calculationFifty candidate levels per hundred days is not a plan, so you have to choose between them.
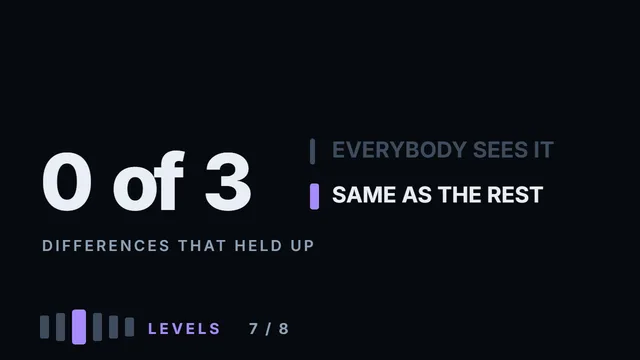 Levels · 7 of 8 · 11 minThe Levels Everyone Sees calculationThis video was planned as an explanation of why the levels everybody sees work better.
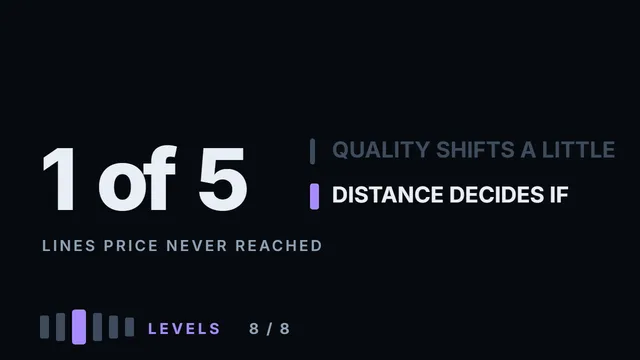 Levels · 8 of 8 · 11 minMarking Up a Chart From Scratch calculationThe last video of the levels module introduces nothing new.
4 · Risk
Where the stop goes and why, how much room to leave between the level and your order, and the arithmetic that turns both into a position size. Then one real trade taken through every one of those decisions, what having something riding on the trade does to them, and when the right decision is not to trade at all.
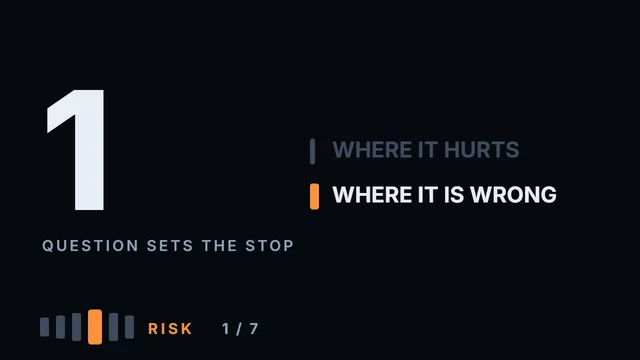 Risk · 1 of 7 · 11 minWhere the Stop Goes - One Question Decides ItYour stop got hit, and then price went exactly where you thought it would.
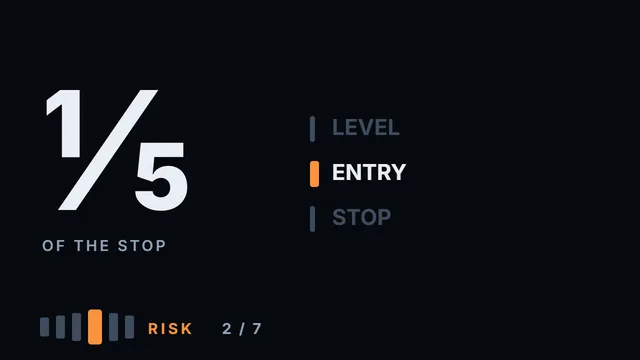 Risk · 2 of 7 · 14 minThe Noise BufferYour limit order sat exactly at the level.
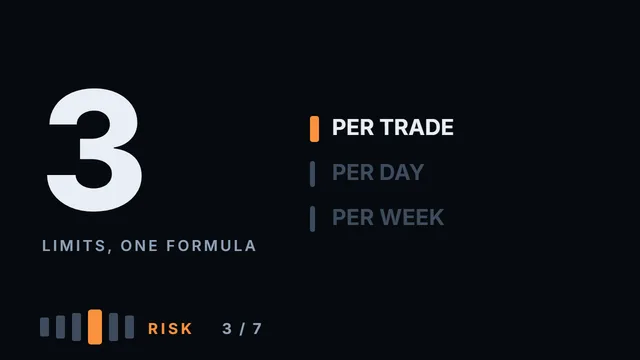 Risk · 3 of 7 · 11 minPosition Size and the Three LimitsTwo traders take the same trade — same level, same entry, same stop — and one ends the day down one percent while the other is down six.
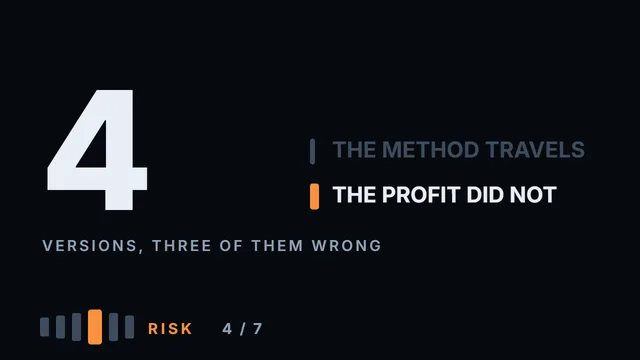 Risk · 4 of 7 · 10 minSame Setup, Crypto vs Stocks calculationOne setup, built mostly from what this channel has already measured, run on three stocks and three coins over the same years.
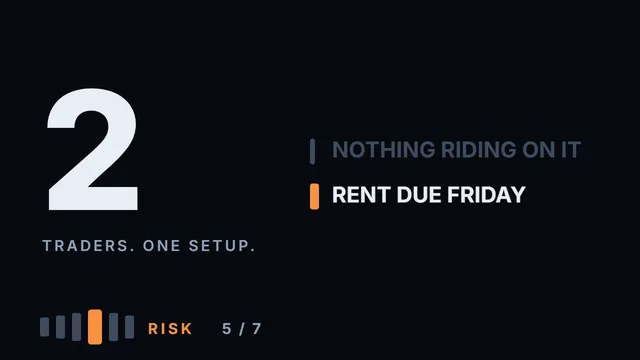 Risk · 5 of 7 · 11 minWhy You Trade Worse When You Need the MoneyTwo traders take the same setup — same instrument, same level, same stop.
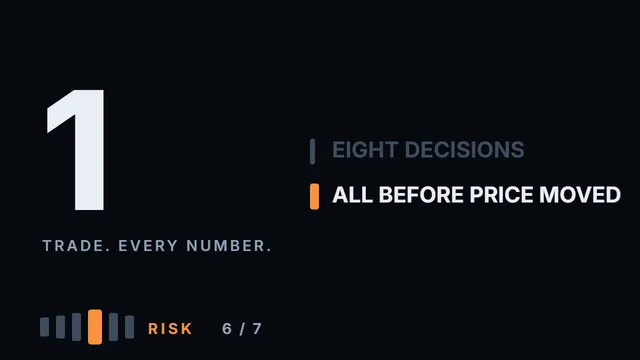 Risk · 6 of 7 · 11 minOne Trade, End to End calculationEvery rule in the risk module, on one real trade: Apple, March 2026, from a blank chart to a journal line, with every number worked out before the order goes in.
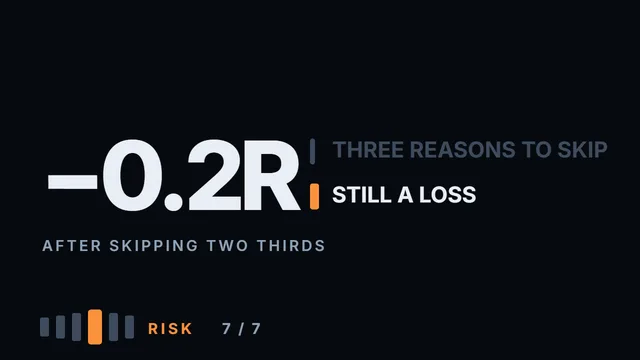 Risk · 7 of 7 · 8 minWhen Not to Trade calculationNot taking a trade is a decision too, and it can be measured.
5 · Setups
Bounce, breakout, false breakout, range and retest, on the same levels with the same accounting. Each set of rules is measured on its own, and once the count is honest most of them come out close to zero or below — the videos say plainly which is which. The module ends with what to do once a trade is open: breakeven, half off, or leave it alone.
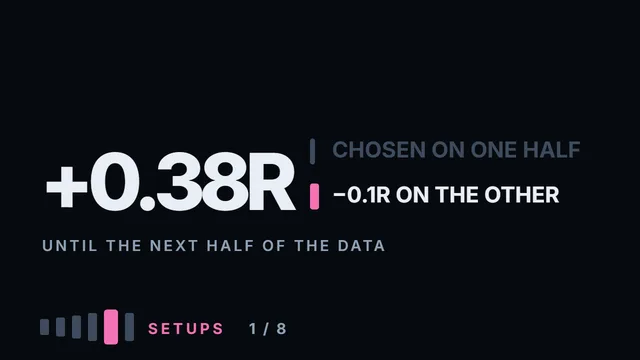 Setups · 1 of 8 · 11 minI Tested the Bounce Trade, One Decision at a Time calculationThe crypto-versus-stocks video measured the bounce trade and it lost money on all six instruments — so this one cannot be "how to trade the bounce".
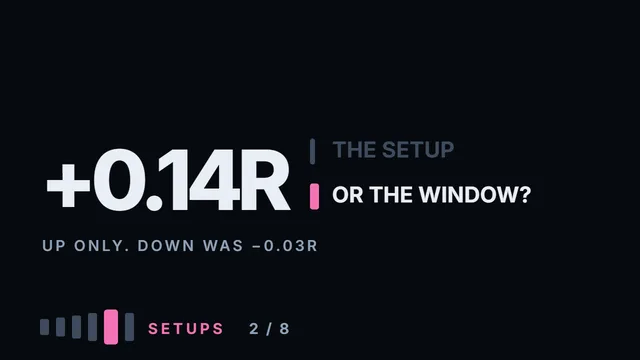 Setups · 2 of 8 · 12 minI Tested Whether Obvious Levels Break Better calculationThe levels module measured a visible level — a sixty day extreme — on daily bars and could not tell it from an unremarkable one: it bounced about as often, and its fewer false breaks and further moves were only a lean.
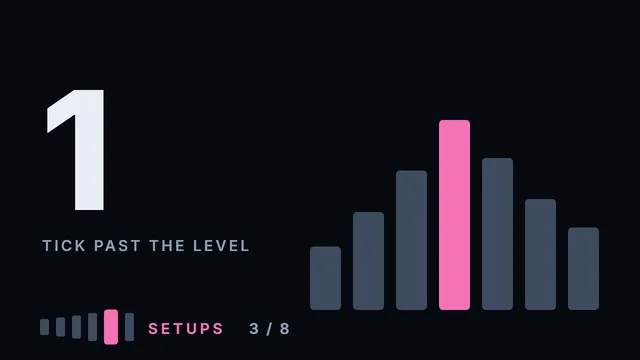 Setups · 3 of 8 · 11 minWhy False Breakouts ExistPrice broke the level, you took it, and twenty minutes later you were stopped out with price back inside the range.
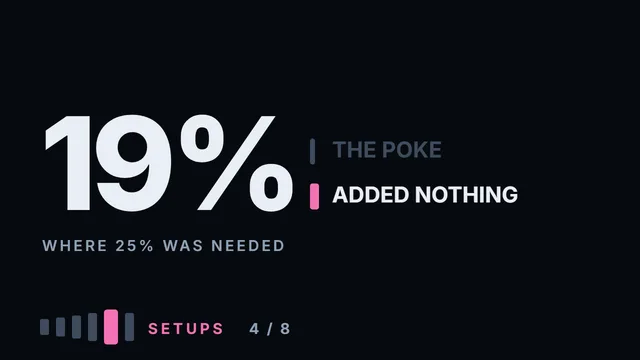 Setups · 4 of 8 · 11 minI Tested Trading the False Breakout calculationThe previous video explained why false breakouts happen.
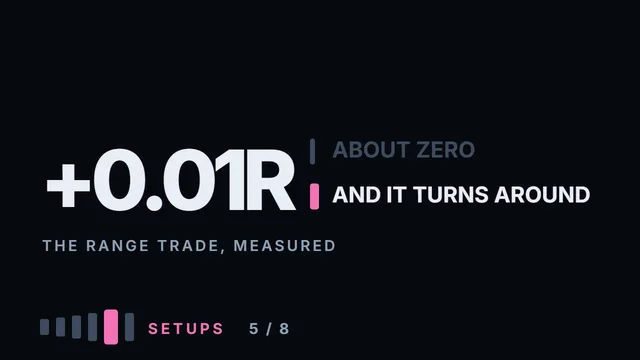 Setups · 5 of 8 · 11 minI Tested the Range Trade and the Retest calculationIn the breakout video the trade came out slightly positive, and one split showed where that came from: all of the edge was on the long side, in a window where six instruments went up.
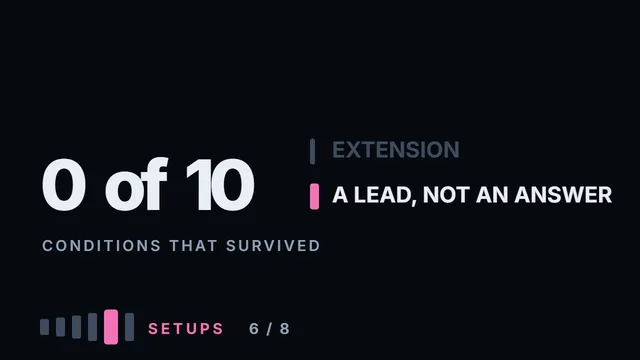 Setups · 6 of 8 · 12 minWhat Has to Be True Before a Breakout Works calculationThe breakout video measured the trade, found three conditions on the level itself, and then one split showed that most of its edge was the direction of the window.
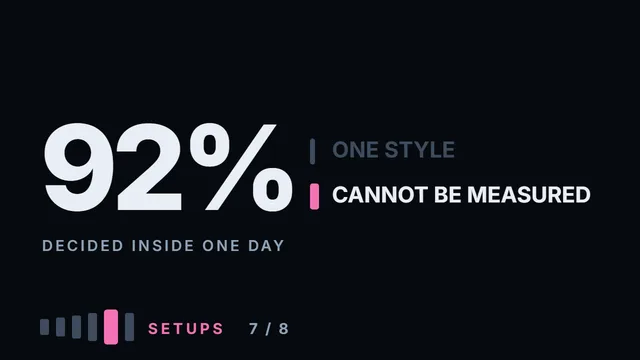 Setups · 7 of 8 · 10 minI Tested Three Ways to Trade the Same Level calculationThe same event — price arriving at a level — can be traded three completely different ways, and people argue about which one is right.
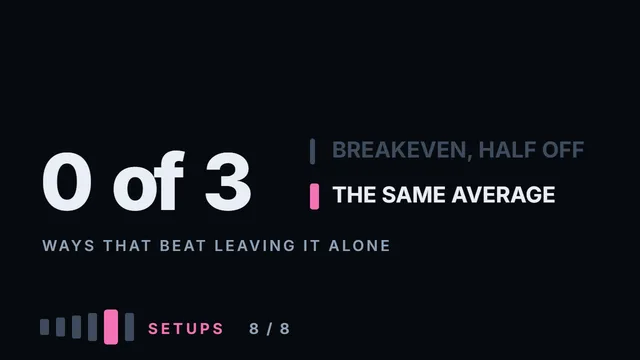 Setups · 8 of 8 · 7 minI Tested Moving the Stop to Breakeven and Taking Half Off calculationBetween the entry and the exit there is a stretch the course had not measured: the days the trade is open.
6 · System
Your own way of working: what is worth looking at before the session opens, what belongs in a plan and in a journal, which of your statistics still hold when the history is cut in half, what a daily chart cannot answer, how to tell whether a change of your own works, and where experienced traders genuinely disagree. The course ends with the ten claims that survived the count.
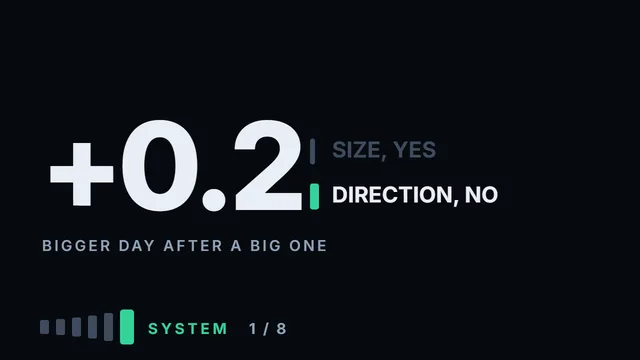 System · 1 of 8 · 10 minWhat's on the Screen Before the Session calculationBefore the market opens you can already see yesterday's bar, the gap, where price closed inside its recent range, whether yesterday closed above the day before, and what day it is.
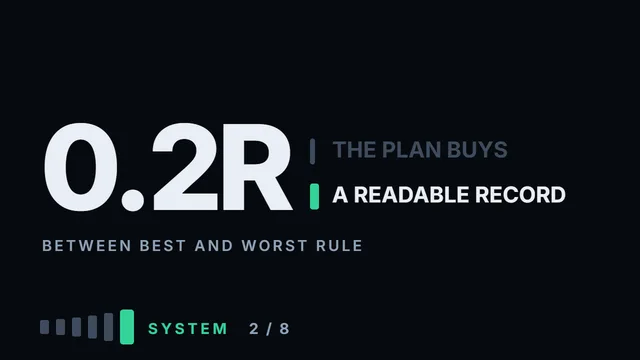 System · 2 of 8 · 11 minWriting a Trading Plan You'll Actually Follow calculationA trading plan is decisions made in advance.
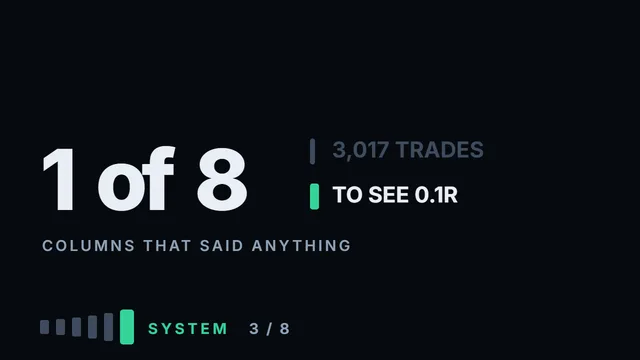 System · 3 of 8 · 10 minThe Trade Journal: What to Log, What to Ignore calculationEvery trading course tells you to keep a journal, and most hand you a template with twenty columns: entry, exit, setup, mood, news, sleep, confidence, market condition.
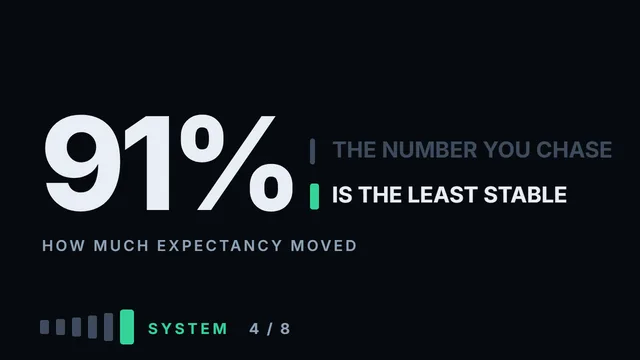 System · 4 of 8 · 11 minReading Your Own Statistics calculationEvery course ends the same way: keep a journal, compute your statistics, and the numbers will tell you whether your system works.
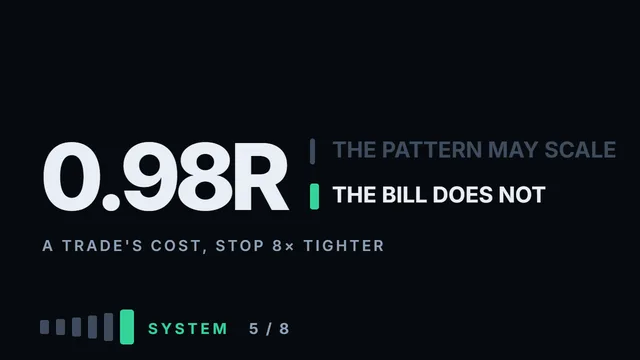 System · 5 of 8 · 7 minWhy a Daily Bar Cannot Answer This calculationEverything this course measured, it measured on daily bars: four prices a day, six instruments, a few years.
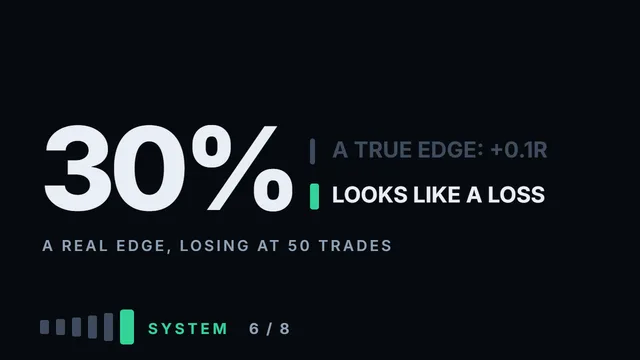 System · 6 of 8 · 7 minHow to Know Whether Your Version Works calculationYou changed something — a wider stop, a later entry, half off at the first target — and you want to know whether it works.
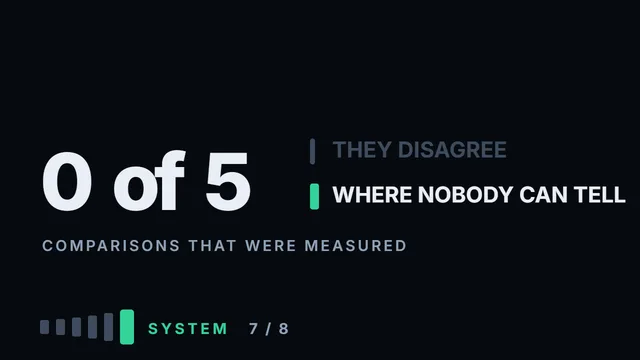 System · 7 of 8 · 10 minWhere Experienced Traders Disagree calculationAsk five experienced traders where the stop goes and you get five answers, delivered with complete confidence, at least two of them opposite.
 System · 8 of 8 · 7 minWhat Survived calculationThe last video of the course.