I Tested Trading the False Breakout
 Video coming soon on YouTube
The previous video explained why false breakouts happen. This one checks whether that explanation is a trade. It is not — and the reason is more useful than the entry would have been.
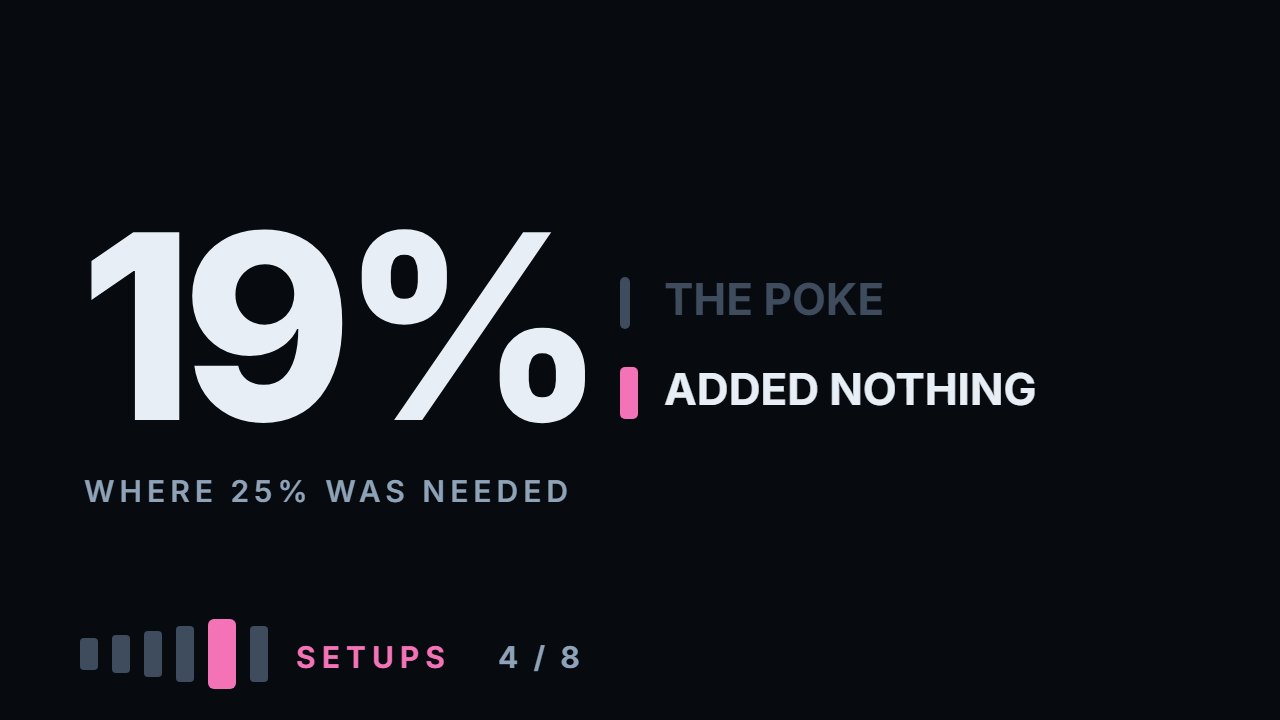
192 false breakouts across six instruments, each day counted once. Sold the way it is taught, they reach a target of three stops 19% of the time, where 25% is break even. The control group — days that came to the level and did not break it — reaches it 18% of the time, within what this many trades can tell apart. The poke through, the thing the whole setup is named after, adds nothing measurable. Everything here is measured: the calculation ships with the video.
What to do with this
Take one instrument and mark levels by the plain rule: a high above the five bars either side. Find every day that poked through one and closed back under. For each, write the distance to the next level below divided by your stop, and whether price reached three of those stops before it reached the high of the poke.
Chapters
- 0:00The mechanism, and the obvious next step
- 0:33What the poke is worth as a signal
- 0:47The entry as it is normally taught
- 1:13How a level was defined, deliberately blunt
- 1:58A hundred and ninety two of them
- 2:26The control, and why it decides everything
- 3:06The trade
- 3:29The false breakout entry
- 3:42The control
- 4:30The real breakouts, sold the same way
- 4:48One of them, on real prices
- 5:36Why the stop went
- 5:52The other targets
- 6:27The raw movement
- 7:04The honest limits
- 7:43What survives
- 8:05One — room
- 8:21Two — a price where you are wrong
- 9:08The uncomfortable reading
- 9:43Go and do this
The calculation
Every number this lesson says out loud comes from the script below. results.txt is what it printed when the video was made.
Full transcript
Price pokes past an obvious level, the stops behind it fire, and price falls back. The mechanism is real; the previous video showed why it happens.
So the natural next step is the one every course takes. If you know why it happens, trade it. Wait for the poke through, wait for the return, and go the other way.
I counted a hundred and ninety two of them. The entry does not work, and the reason it does not work is more useful than the entry would have been.
By the end of this you will know what the poke through is actually worth as a signal, what it is worth compared to nothing, and which two things have to be around it before any of this becomes a trade.
First, the entry as it is normally taught, because it is specific and that is to its credit. Price trades above an obvious level and closes back below it. You sell. Your protective stop goes above the high of that day. Your target is a multiple of that stop.
Every part of that is checkable. So here is how it was checked.
A level is a bar whose high is higher than the five bars on either side of it. Wider than the two-bar turn of the levels module, on purpose — fewer, more obvious levels. Deliberately blunt — the moment I start refining what counts as a level, I can tune the rule until the answer comes out the way I want.
A false breakout is the first day after that level where price trades above it and closes back below. A real breakout is the same day, closing above. A day counts once, even when it crosses several levels. Six instruments, eight years of daily bars for the stocks.
A hundred and ninety two false breakouts. Two hundred and twenty two real ones.
Worth noticing how rare that is. On Apple, a hundred and thirteen levels over eight years produced forty nine of them — about six a year. On the fund tracking the index, under five. Even if the entry had worked, you would be waiting months between them.
And one more group, which is the part that decides whether any of this means anything. The control.
A control is a day that came to the level and did not poke through it. Within half a per cent, close enough to be the same situation, but no break.
Without it you are not measuring the poke. You are measuring what price does near a level, which it does anyway. That was the lesson of the gaps video, and it applies here with more force.
A hundred and forty eight of those, none of them a day that poked through another level. Now the trade.
Short at the close of the event day. Protective stop above that day's high. Target three times the stop. Hold up to twenty sessions; anything unresolved after that does not count.
At a target of three stops you break even at twenty five per cent, and that number comes from the win-rate video.
The false breakout entry: a hundred and eighty eight trades, nineteen per cent reached the target before the stop. Expectancy minus zero point two six R.
Now the control. The days that came to the level and did not break it.
A hundred and forty five trades. Eighteen per cent. Minus zero point two eight R.
The same. Not to the decimal, but well within what two hundred trades can tell apart. The poke through, the thing the entire setup is named after, added nothing measurable at all.
Say that plainly, because it is the finding. Selling after a false breakout performed exactly like selling after price merely touched the level and turned. The mechanism from the previous video may well be real — daily bars cannot show it. As a signal, on this evidence, it is worth nothing extra.
The real breakouts, sold the same way, did worse: two hundred and twenty trades, twelve per cent, minus zero point five one R. Which is what you would expect — that is selling into something that just went the other way.
Here is one of them, on real prices, so it is not a diagram. Apple. A level at two hundred and seventy seven eighty four, left by a turning point on the second of January.
On the fourth of February price trades up to two hundred and seventy eight ninety five — through the level — and closes at two hundred and seventy six forty nine. Back underneath. That is the setup, exactly as taught.
So you sell at the close. Your stop goes above the high of the poke, two hundred and seventy eight ninety five. That is two dollars and forty six cents of risk. Three times it puts the target at two hundred and sixty nine eleven.
The next session took out the stop. Not a conspiracy, and not bad luck. The stop was placed where the candle happened to end, not where sellers would have been proven wrong — and the risk module has a whole video about the difference.
The obvious objection is the target, so here are the others. At a target of one stop, where you need fifty per cent, the false breakout gives thirty three and the control twenty eight. At two stops, where you need thirty three, they give twenty five and twenty four.
At every target the entry loses money, and at every one of them the poke is within what this many trades can tell apart from a plain touch. This is not an artefact of one choice.
Look at the raw movement and the same shape appears. In the five sessions after a false breakout, price travels zero point eight nine of a daily range down and one point four up. The direction that is supposed to be the trade is the smaller of the two.
Against the control at zero point six seven down and one point three one up. After a poke, price went a little further down — and further up as well. More movement, not a clear direction.
Now the honest limits, and they are real, because this is where a channel can quietly cheat.
Daily bars cannot see inside a day. The usual teaching enters during the session, with a resting order just past the level, not at the close hours later. What is measured here is the version these data allow, and it is not the same trade.
Two hundred events is enough to say the entry loses money. It is not enough to say what the poke adds: anything up to a third of a stop either way.
What survives is the mechanism, as an explanation rather than a measurement — and it is worth more than the entry was. A poke through may be a pool of orders being reached. Not a prediction, and not a signal on its own.
So what makes it a trade. Two things, and neither of them is the poke itself.
The first is room. The distance from your entry to the next level below, divided by your stop. The range module asks for six; with the stop above the poke, seven setups in ten fall short of it.
The second is a price where you are wrong. Not the high of the poke because it is convenient, but the price at which sellers are demonstrably not in control any more. The risk module works that out, and it is not the high of the poke: on these events it sat below that high more often than above it.
Put those two around a false breakout and you have a trade you can test. Room alone did not rescue it here: six stops of room or more came out at minus zero point two four R, and less than six at minus zero point two six. Take the poke on its own and you have nineteen per cent where you needed twenty five.
There is one more reading of all this, and it is the uncomfortable one. If the poke adds nothing to a plain touch, then the trades you thought you were losing to stop hunts were being lost to the entry itself.
What that changes today is small and specific. Nothing about how you read a false breakout — that part was right. Only this: stop treating the poke as the reason to enter, and start treating it as the thing that tells you where the orders were.
So, the thing to go and do, and it costs nothing but an evening. Take one instrument and mark the levels by the plain rule: a high above the five bars either side — and, for the room, a turning low below.
Find every day that poked through one and closed back under. For each, write two numbers: the distance to the next level below, divided by what your stop would have been, and whether price reached three of those stops before it reached the high of the poke.
Ten of those will not give you your own nineteen per cent: at ten trades, luck alone can move it twenty points either way. Ten give you the habit; fifty start to give you the number. Educational content only. Nothing here is financial advice.
Educational content only. Nothing in this video is financial advice, a recommendation to buy or sell, or a promise of any result. Trading involves risk of loss. Do your own research. Risk warning.