Reading Your Own Statistics
 Video coming soon on YouTube
Every course ends the same way: keep a journal, compute your statistics, and the numbers will tell you whether your system works. Nobody tells you which of those numbers survive being measured twice. This video takes a trade history simulated on real prices — 385 trades from a setup this channel already measured — cuts it in half by time, and computes eight standard statistics on each half with the same rules. A number that comes out roughly the same on both halves is telling you about the method. A number that does not is telling you about the past, and only about the past.
The sample sizes are deliberately realistic. Split in half, each instrument gives between 19 and 48 trades per half, which is roughly what a person actually has after a year or two of trading — not ten thousand. Every result below is measured at the size you will really be working with.
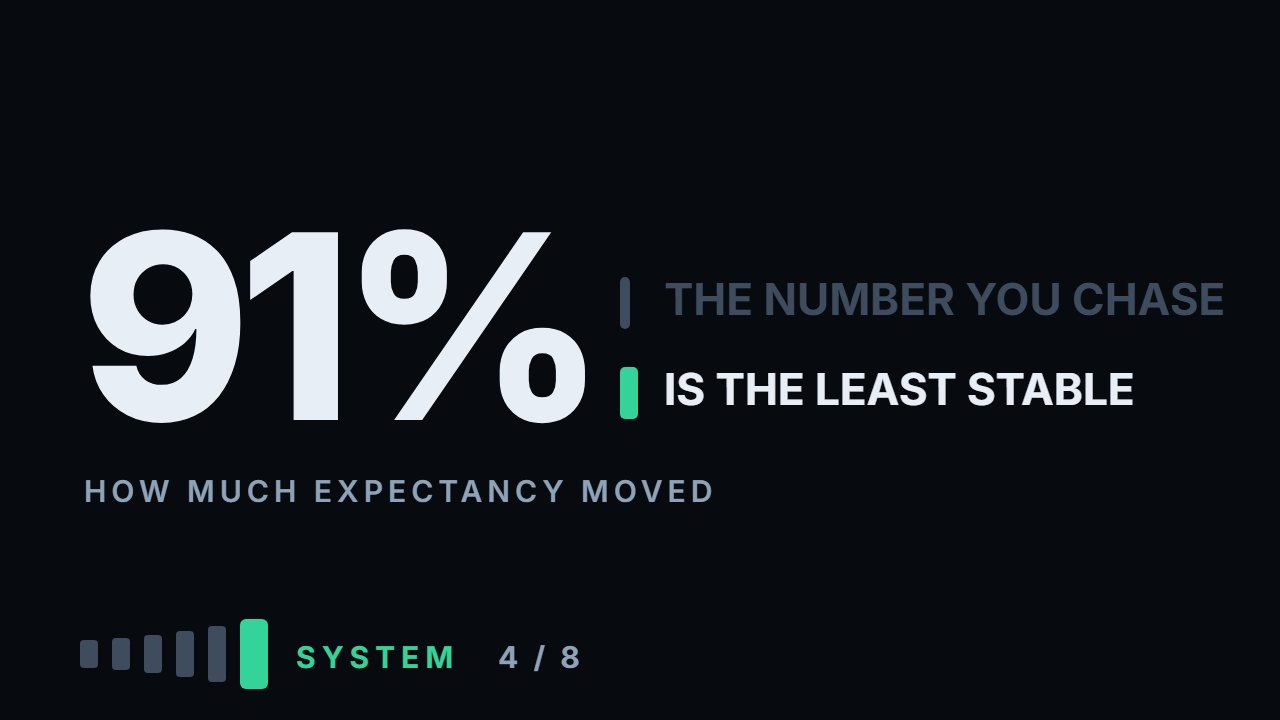
The most stable statistic is the one nobody quotes: the average loss in R, which moves by 5 percent of its own size between halves. That makes sense — the average loss is set by your stop, the one thing in this list you control. Win rate is second at 13 percent. Then share of profit from the single best trade at 22, profit factor at 29 — on Ethereum the profit factor went from 1.70 to 0.47 — average win at 31, longest losing streak at 33, and maximum drawdown — the deepest fall of the account from its last peak — at 42 percent, which on Bitcoin meant going from 9.2R to 17.7R using the same rules on the same market. And last, the number every course tells you to maximise: the average trade, expectancy, R per trade. It moved by 91 percent of its own size — almost the number itself. Two of six instruments flipped sign, both from profit to loss, and a third nearly vanished.
The reason is arithmetic rather than psychology: expectancy is a small difference between two large quantities, and small differences of large numbers inherit all the noise of both. So how many trades does it take to settle? In blocks of twenty, the win rate ranges from 10 to 50 percent and the average trade from −0.76R to +0.69R. In blocks of a hundred, 30 to 40 percent and −0.16R to +0.20R. Four blocks hide the real spread: at a hundred trades, two error bars on the win rate still reach nearly ten points either way, and on expectancy almost three tenths of an R — less than most people assume. Everything here is measured, and the calculation ships with the video.
What to do with this
Compute one number from your existing log: your average losing trade, measured in R — the loss divided by the risk you had on at entry. If it is close to minus one, your stops do what you wrote down and you can start trusting the rest of your numbers. If it is not, no other statistic in your journal means anything yet, because they are all built on a risk unit you are not actually using.
Chapters
- 0:00Which numbers survive being measured twice
- 0:26The test, and where the trades come from
- 1:15The sample size you actually have
- 1:35The most stable number is the one nobody quotes
- 2:10Why the average loss holds still
- 2:21Win rate, second
- 2:50Profit factor, and Ethereum
- 3:15Maximum drawdown, and Bitcoin
- 3:46The number every course tells you to maximise
- 4:01It moved more than its own size
- 4:50The ranking is the reverse of the attention
- 5:11Why, in arithmetic rather than psychology
- 5:45How many trades does it take
- 6:42A hundred trades, and what they buy
- 7:15What to read and what to stop reading
- 8:46Three limits
- 9:23Go and do this
The calculation
Every number this lesson says out loud comes from the script below. results.txt is what it printed when the video was made.
Full transcript
Every course ends the same way. Keep a journal, compute your statistics, and the numbers will tell you whether your system works.
Nobody tells you which numbers survive being measured twice. That is what this video does. By the end you'll know which of your statistics to trust first, and which to ignore until well past a hundred trades.
Here is the test, and it is the same one this channel has used on most of its setups.
Take a trade history simulated on real prices. Cut it in half by time. Compute each statistic on the first half and on the second half of the same history, with the same rules.
A number that comes out roughly the same on both halves is telling you about the method. A number that does not is telling you about the past, and only about the past.
The trades come from a setup this channel already measured: touch of a level, enter on confirmation, stop one daily range, target three stops.
Three hundred and eighty five trades across six instruments, and here is the part that makes this honest.
Split in half, each instrument gives between nineteen and forty eight trades per half. That is roughly what a real person actually has after a year or two.
Not ten thousand. Twenty to fifty. Every number below is measured on the sample size you will really be working with.
Eight statistics. Start with the one that came out most stable, because it is the one nobody quotes.
The average loss, in R. First half against second half: minus zero point nine two against minus zero point nine six on Apple. Minus one point zero zero against minus zero point nine five on Tesla.
Across six instruments the median change between halves is zero point zero five of an R. Relative to its own size, five percent.
Which makes sense the moment you see why. The average loss is set by your stop, and your stop is the one thing in this list you actually control.
Second most stable: the win rate. Median change between halves, almost four percentage points. Relative to its own size, thirteen percent.
That sounds like a lot, almost four points, until you compare it with what is coming.
Share of profit from the single best trade, twenty two percent. Average win, thirty one. Longest losing streak, thirty three.
Profit factor: twenty nine percent. On Ethereum it went from one point seven to zero point four seven.
Read that one again. The same rules, the same instrument, two halves of the same history: a system that made seventy percent more than it lost, and then made less than half of what it lost.
Maximum drawdown, the deepest fall of the account from its last peak, counted in R: forty two percent. On Bitcoin it went from nine point two R to seventeen point seven.
If you sized your position so that your worst historical drawdown was survivable, that number nearly doubled on you — and on Ethereum it grew almost two and a half times — using the same rules on the same market.
And now the last one, which is the number every course tells you to maximise.
The average trade. Expectancy. R per trade. The single number that decides whether a system is worth trading.
Its median change between the two halves is ninety one percent of its own size.
Almost the number itself. On Ethereum: plus zero point three five on the first half, minus zero point three two on the second.
On Solana, plus zero point two two to minus zero point two one. On Tesla, plus zero point two one to plus zero point zero two — almost all of it gone.
Two of six flipped sign, both from profit to loss, and a third nearly vanished. Not shrank — flipped. But only Ethereum's change clears two error bars.
So the ranking, from most transferable to least, is almost exactly the reverse of how much attention each number gets.
Average loss and win rate are stable. Profit factor and drawdown are shaky. Expectancy, the one you are told to optimise, is the least stable thing you can compute.
There is a reason, and it is arithmetic rather than psychology.
Your average loss is one number, pinned by a rule you wrote. Your win rate is a count, and a count settles faster than a difference of two sums — though not fast.
Expectancy is a small difference between two large quantities — everything you won and everything you lost. Small differences of large numbers inherit all the noise of both.
Which brings the real question: how many trades does it take before expectancy stops jumping?
Same three hundred and eighty five trades, cut into blocks of equal size, and we look at the spread between blocks.
In blocks of twenty trades, the win rate ranges from ten percent to fifty. The average trade ranges from minus zero point seven six of an R to plus zero point six nine.
Twenty trades is what most people have when they first sit down to evaluate themselves, and at twenty trades the answer is anything you like.
In blocks of fifty: win rate twenty to forty two percent, average trade minus zero point three six to plus zero point three one.
Better. But the spread is still wide enough to contain both "this works" and "stop immediately".
In blocks of a hundred: win rate thirty to forty percent, average trade minus zero point one six to plus zero point two.
But four blocks hide the real spread. At a hundred trades, two error bars on your win rate still reach nearly ten points either way, and on your average trade almost three tenths of an R.
That is the honest number for what a hundred trades buys you, and it is less than most people assume.
So what should you actually read, and what should you stop reading?
Read your average loss first. If your stop is one R and your average loss is not close to one R, something in your execution is not what you think it is.
Bigger than one R means losers are getting past your stop — your hand moving it, or gaps filling it worse than its price. Smaller means something closes losers before the stop — your hand, or a time exit or a trail in your own rules. In these trades the ten-day exit alone pulls the average loss to about zero point nine.
That number needs about twenty trades to be meaningful, and it is the only one that does.
Read your win rate second. It needs well over a hundred trades to settle, and it is not a measure of quality — it is a description of your exit rule.
A three-R target produces a low win rate by construction. A tight target produces a high one. Neither is virtue.
Stop reading your profit factor and your maximum drawdown until you are well past a hundred trades. On this data they changed by a third and by two fifths between halves.
And treat your average trade as the last thing you learn about yourself, not the first.
Three limits. One: one setup, six instruments, one window. A different setup would give different stability, though the arithmetic reason for the ranking does not depend on the setup.
Two: these are simulated trades with a mechanical exit. Your own record has hesitation and rule-breaking in it, which makes everything less stable, not more.
Three: I split by time. Splitting by instrument or by market condition would give different answers, and both are worth doing on your own record.
So, what to go and do. Twenty minutes, and it needs nothing but your existing log.
Compute one number: your average losing trade, measured in R — the loss divided by the risk you had on at entry. No trades yet? Then this one waits: write the risk at entry next to every trade from the first one, so the number exists when you need it.
If it is close to minus one, your stops do what you wrote down, and you can start trusting the rest of your numbers.
If it is not, no other statistic in your journal means anything yet, because they are all built on a risk unit you are not actually using.
Eight statistics, measured twice on the same history. The one everybody optimises moved almost its whole size. Educational content only. Nothing here is financial advice.
Educational content only. Nothing in this video is financial advice, a recommendation to buy or sell, or a promise of any result. Trading involves risk of loss. Do your own research. Risk warning.