The Trade Journal: What to Log, What to Ignore
 Video coming soon on YouTube
Every trading course tells you to keep a journal, and most hand you a template with twenty columns: entry, exit, setup, mood, news, sleep, confidence, market condition. The implication is that one day you will look back and one of those columns will explain everything. This video measures which columns can ever do that, at the number of trades you will actually have — which turns out to be the only question that matters.
Two kinds of column get mixed together in those templates. Arithmetic — entry price, stop price, exit price, size, date — is the measuring stick, and without it you cannot compute a single number from the statistics video. Features are everything else, kept in the hope that some day a difference shows up along one of them. Eight features were tested here on 365 trades of a setup this channel already measured, with one question each: does this column split the trades into two groups with genuinely different results? Instrument class: −0.02R, error ±0.15. Direction: +0.19R, error ±0.14 — the largest positive difference in the list, and it still does not clear the bar. A 60 day extreme: −0.37R, error ±0.17 — that one clears it, at 2.2 error bars. Quiet market beforehand: −0.10. Far from its average: −0.04. Yesterday was big: −0.16. Monday or Friday: −0.10. Level older than a month: +0.07. Eight columns, eight results, one that clears two error bars.
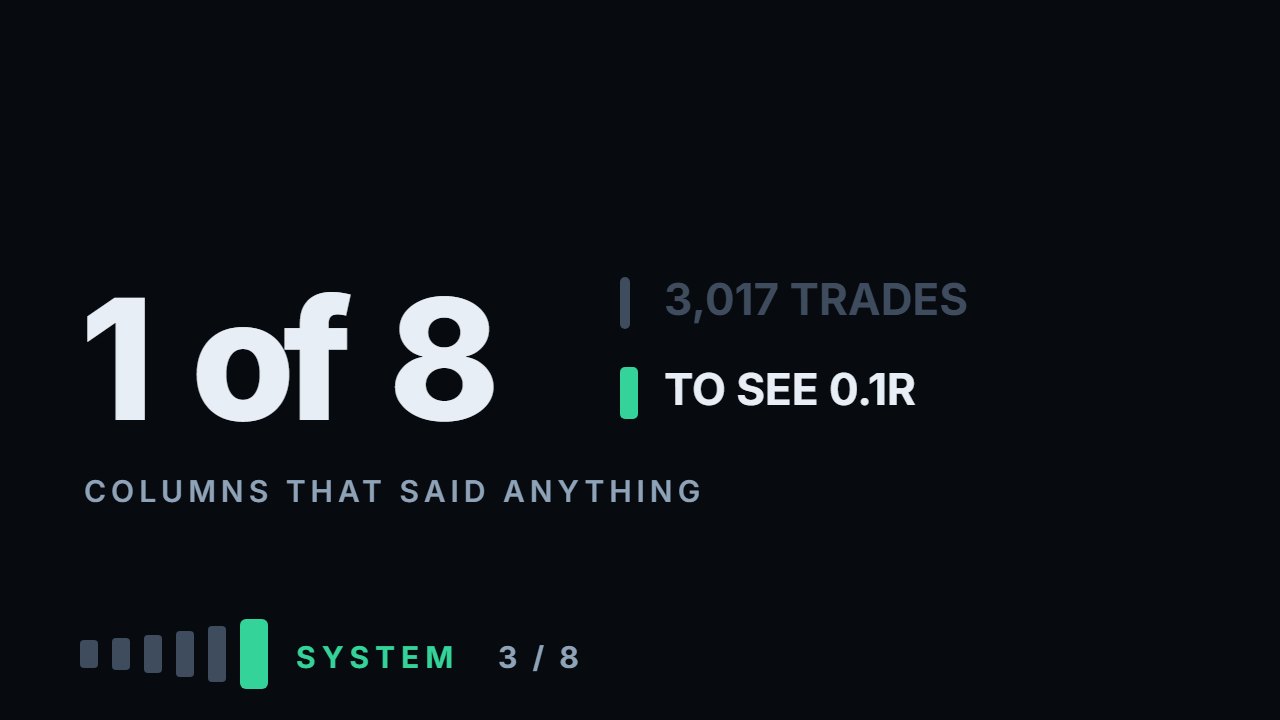
That includes features this channel has looked at elsewhere — compression and direction both vanish here, while visibility is the one that survives. They were measured on six hundred to a thousand trades of a specific event; here they are looked at through 365 trades of a different one. That is not a contradiction, it is what sample size does, and it turns the question into an arithmetic one. The spread of a single trade here is 1.37R, so for a difference of a given size to clear two error bars you need about eight sigma squared over that difference squared trades in each group — and even then a real difference clears it only half the time. Half an R takes 121 trades in total. Two tenths takes 754. One tenth — the size of most real effects this channel has found — takes 3,017, which at two trades a week is thirty years. Five hundredths takes 12,068.
There is a second problem running the other way: test twenty columns at the usual threshold and about one passes by chance alone, so a twenty-column journal is expected to produce about one exciting finding even when every column is worthless — and that is the one you will remember. So: keep all the arithmetic, keep at most two or three features chosen before you start and written as questions, and add the column nobody puts in — did I follow my own rules on this trade, yes or no. That one cannot be measured on mechanical trades, but one ignored stop can cost a whole R on a single trade, so it needs far fewer trades to show up, and it is the only one you control directly.
What to do with this
Open your journal template and mark every column as either arithmetic or feature. Keep all the arithmetic. Then keep at most three features, and only ones you can state as a question before you look — chosen afterwards by seeing which column happens to separate is exactly how the one-in-twenty finding gets picked. Delete the rest, and add one column: rules followed, yes or no. In six months that column will have taught you more than the other nineteen together.
Chapters
- 0:00Twenty columns and the promise behind them
- 0:21What this video measures
- 0:42Arithmetic columns: the measuring stick
- 1:10Feature columns: the hopeful half
- 1:20Eight features, 365 trades
- 1:39The spread of a single trade
- 1:58Instrument class
- 2:22Direction, the largest positive difference
- 2:43Was the level a sixty day extreme
- 3:18The last three features
- 3:38Eight columns, one of them measurable
- 3:55Why this channel's own findings vanish here
- 4:22The real question: how many trades
- 4:36The arithmetic
- 5:00Two tenths of an R
- 5:23Three thousand trades is thirty years
- 5:33What a journal column can answer
- 5:48The finding you will remember
- 6:40What actually belongs in the journal
- 7:00At most two or three features
- 7:16The column nobody puts in
- 7:43Three limits
- 8:23Go and do this
- 8:49Delete the rest, add one column
The calculation
Every number this lesson says out loud comes from the script below. results.txt is what it printed when the video was made.
Full transcript
Every trading course tells you to keep a journal, and most of them hand you a template with twenty columns.
Entry, exit, setup, mood, news, sleep, confidence, market condition. The implication is that one day you will look back and one of those columns will explain everything.
This video measures which columns can ever do that, at the number of trades you will actually have. By the end you'll be able to cut your journal to the columns that can ever tell you something.
Start by separating two kinds of column, because mixing them is where the twenty-column template comes from.
The first kind is arithmetic. Entry price, stop price, exit price, position size, date.
Without those you cannot compute a single number from the statistics video, which comes next. Not R, not the average loss, not the win rate. They are not predictions, they are the measuring stick.
That kind is not up for debate and not what this video is about.
The second kind is features. Everything else in the template. They are there in the hope that some day a difference will show up along one of them.
So: eight features, three hundred and sixty five trades from a setup this channel already measured, and one question each.
Does this column split the trades into two groups with genuinely different results?
Before the answers, the number that decides all of them.
The spread of a single trade in this sample is one point three seven of an R. One trade tells you almost nothing, and that is not a flaw in the setup — it is what trading is.
Every column in your journal has to find a difference through that much noise.
Feature one: instrument class. Crypto against stocks. Difference minus zero point zero two of an R, error plus or minus zero point one five.
Noise. A difference counts as measured only when it is at least two error bars away from zero. Here the error bar alone is bigger than the difference.
Feature two: direction. Selling at resistance against buying at support. Difference plus zero point one nine, error zero point one four.
Closer, and still not there. It is one point four error bars from zero, and it needs two.
Feature three: was the level a sixty day extreme. Minus zero point three seven, error zero point one seven. That one clears the bar.
Feature four: was the market quiet beforehand. Minus zero point one, error zero point two two. Noise.
Feature five: was price far from its average. Minus zero point zero four, error zero point one four. Noise.
Feature six: was yesterday a big day. Minus zero point one six. Feature seven: Monday or Friday. Minus zero point one. Feature eight: was the level older than a month. Plus zero point zero seven.
Seven of the eight are noise. Eight columns, eight results, one that clears two error bars.
And that includes columns this channel has looked at elsewhere — compression and direction both vanish here.
Which is the point, and it is not that those findings were wrong.
They were measured on six hundred to a thousand trades of a specific event. Here the same features are looked at through three hundred and sixty five trades of a different one.
Same features, smaller sample, and most of them vanish. That is not a contradiction. That is what sample size does.
So the real question is not which column to keep. It is how many trades a column needs before it can say anything at all.
And that has an exact answer, so let us compute it instead of guessing.
For a difference of size delta to clear two error bars through a spread of one point three seven, you need about eight sigma squared over delta squared trades in each group. And even then a real difference clears it only half the time.
For a difference of half an R: a hundred and twenty one trades in total. That is reachable.
For two tenths of an R: seven hundred and fifty four trades.
For one tenth: three thousand and seventeen trades. And a tenth of an R is the size of most of the real effects this channel has found.
For zero point zero five of an R: twelve thousand and sixty eight.
Those are trades you have to actually take, not days on a chart. At two trades a week, three thousand trades is thirty years.
So a journal column can realistically only ever answer about differences of half an R or bigger.
If you believe a column hides a tenth of an R, you are right to believe it and wrong to expect your journal to show it.
There is a second problem, and it works in the opposite direction.
If you keep twenty columns and test each one at the usual threshold, roughly one in twenty passes by chance alone.
So a twenty-column journal is expected to produce about one exciting finding even when every single column is worthless.
And it will be the column you remember, because it is the one that looked like something.
Here there were eight columns and one passed; chance alone would produce about half of one. The one that passed is a feature the levels module had already measured on far more events, which is the only reason I am willing to believe it.
Which is the practical rule: the fewer columns you keep, the more a surprise in one of them means.
So, what actually belongs in the journal.
Everything in the first group, always: entry, stop, exit, size, date, instrument. Those let you compute your average loss, and the statistics video will show that is the one number that settles quickly.
Then at most two or three features, chosen before you start, written down as questions you intend to answer.
Not chosen afterwards by looking at which column happens to separate — that is how the one-in-twenty finding gets picked.
And then the column nobody puts in: did I follow my own rules on this trade, yes or no.
This data cannot measure that one, because these trades never break their rules. But one ignored stop can cost a whole R on a single trade, so it needs far fewer trades to show up, and it is the only one you control directly.
Three limits. One: one setup, three hundred and sixty five trades. A setup with genuinely large differences between groups would show them here.
Two: the sample-size arithmetic assumes trades are independent. Yours are not — you trade the same instruments in the same weeks — so the real requirement is higher, not lower.
Three: I tested features that are knowable at entry. Mood and sleep are not in this data, and I am not claiming they are worthless, only that they face the same wall.
So, what to go and do. Fifteen minutes, and it mostly involves deleting things.
Open your journal template and mark every column as either arithmetic or feature. No journal yet? Start one with the arithmetic columns only.
Keep all the arithmetic. Then keep at most three features, and only ones you can state as a question before you look.
Delete the rest, and add one column: rules followed, yes or no. In six months that column will have taught you more than the other nineteen together.
Eight features, three hundred and sixty five trades, one column that clears two error bars. A journal is for arithmetic first and questions second. Educational content only. Nothing here is financial advice.
Educational content only. Nothing in this video is financial advice, a recommendation to buy or sell, or a promise of any result. Trading involves risk of loss. Do your own research. Risk warning.