Why a Daily Bar Cannot Answer This
 Video coming soon on YouTube
Everything this course measured, it measured on daily bars: four prices a day, six instruments, a few years. This video is about the edge of that choice — what a daily chart can answer, what it cannot, and what moving to a faster chart does to your costs.
A daily bar keeps the open, the high, the low and the close, and no order between them. On the stocks, the sign of the day reversed after the open on 32% of days. In the three-styles video, 92% of the fast way's trades were decided within one day, and 248 of its 783 trades — 32% — touched both the stop and the target on the day of entry, where four prices cannot say which came first. That is why the fast style could not be measured at all, rather than measured as losing. The second limit is sample size: with one trade varying by 1.37R, telling half an R apart takes 121 trades, two tenths 754, a tenth 3,017 — twenty nine years at two trades a week — and a twentieth 12,068.
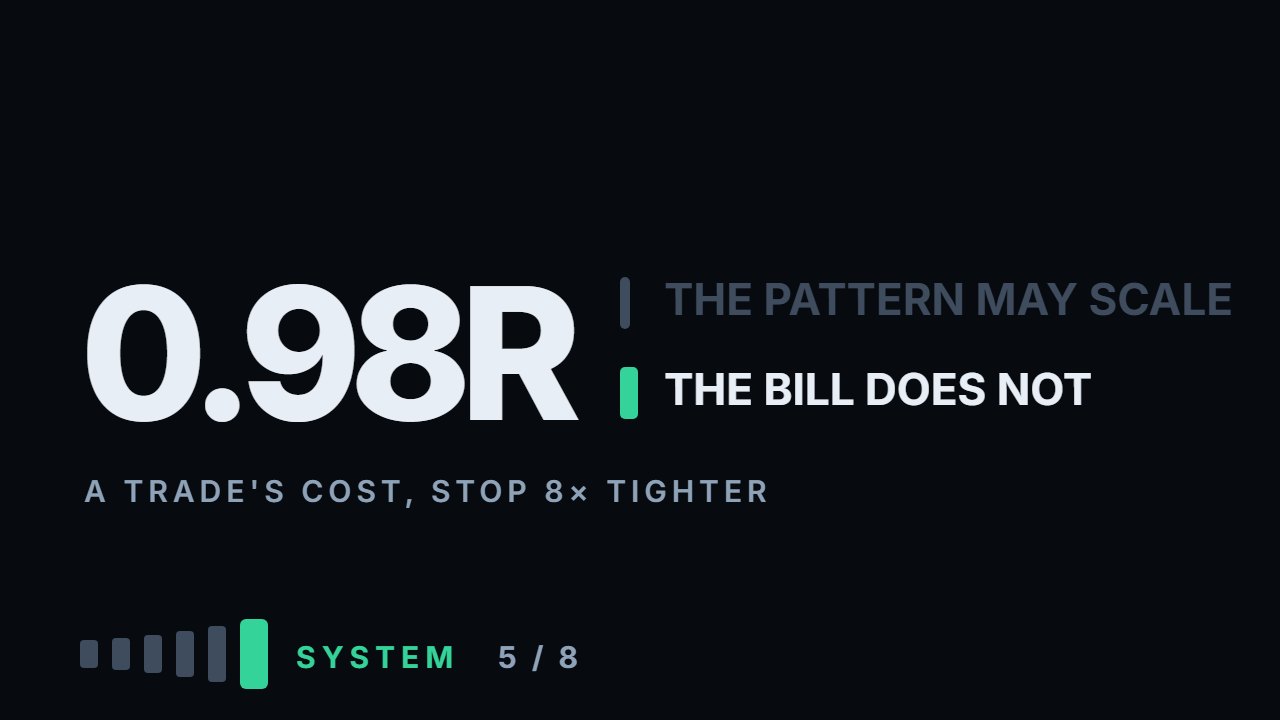
Going faster does not escape it. The shapes may repeat on every timeframe; the costs do not. A trade costs its round trip in per cent of the position divided by its stop in per cent of price, and the fee does not shrink on a faster chart while the stop does. On the daily setup of the crypto-versus-stocks video the index fund and Bitcoin paid 0.12R a round trip; four times tighter, 0.49R; eight times tighter, 0.98R. At the buffer video's stop for trades held for hours, a tenth of the range — five times tighter — it is 0.61R on both, 0.14R on Tesla and 0.3R on Apple. Whatever edge a method has on a faster chart, it pays that first. A daily chart can answer questions about anything known before the trade, about trades that live for days, and about large differences; it cannot answer questions about trades decided inside one day, about differences of a tenth of an R, or about anything that depends on the order of the four prices. Everything here is measured: the calculation ships with the video.
What to do with this
Write down your stop in per cent of price and your round trip from your broker's fee page, and divide one by the other: that is what every trade costs you in R before it starts. Then write down the edge you believe your method has, in R. If it is smaller than that cost, the method cannot work at that stop, on any chart.
Chapters
- 0:00What a daily chart can and cannot answer
- 0:31Four prices, no order
- 1:00Trades decided inside one day
- 1:51How many trades a small difference takes
- 2:46The market is fractal — the costs are not
- 4:36What a daily chart can answer
- 5:04What it cannot
- 5:37Three limits
- 6:13Go and do this
The calculation
Every number this lesson says out loud comes from the script below. results.txt is what it printed when the video was made.
Full transcript
Everything this course has measured, it measured on daily bars. Four prices a day, six instruments, a few years.
That was a choice, and every choice has an edge. This video is about that edge: what a daily chart can answer, and what it cannot.
By the end you'll be able to tell whether a claim you hear can be checked on daily data at all, and what a faster chart does to your costs.
Start with what a daily bar keeps. The open, the high, the low and the close. Four prices, and no order between them.
The chart-reading video put a number on that. On the stocks, the sign of the day reversed after the open on thirty two per cent of days.
A third of days told one story in the morning and the opposite one by the close, and the bar keeps only the ending.
Now take a trade that lives inside one day. The three-styles video measured one: the fast way, entry at the touch, a stop half a range away, one stop of profit.
Ninety two per cent of its trades were decided within one day.
And on the day of entry, thirty two per cent touched both the stop and the target. Two hundred and forty eight trades out of seven hundred and eighty three.
For those, four prices cannot say which came first. The same trade is a win or a loss depending on the order, and the order is not in the data.
That is why that video ended with a result of an unusual kind. Not that the style loses. That a daily chart cannot measure it.
The second limit is not about time at all. It is about how many trades it takes to see a small difference.
The journal video measured how much one trade varies: one point three seven R. Any difference you look for sits under that much noise.
To tell half an R apart takes a hundred and twenty one trades. Two tenths of an R takes seven hundred and fifty four.
A tenth of an R takes three thousand and seventeen trades. At two trades a week, that is twenty nine years.
And a twentieth takes twelve thousand and sixty eight. A hundred and sixteen years.
Most arguments about trading settings are about differences of a tenth of an R or less. On daily data, nobody alive has enough trades to settle them.
So the natural move is to go faster. More bars, more trades, the same method on a five-minute chart. The claim behind that move has a name: the market is fractal.
And the shapes may well repeat on every timeframe. The costs do not.
Here is the arithmetic from the crypto-versus-stocks video. The cost of a trade in R is the round trip in per cent of the position, divided by the stop in per cent of price.
The round trip does not shrink on a faster chart. The stop does.
On the daily setup, with a stop of half a range, the index fund paid zero point one two of an R for a round trip. So did Bitcoin.
Make the stop four times tighter and that becomes zero point four nine. Eight times tighter, zero point nine eight: almost a whole R, before price has moved.
The buffer video's stop for trades held for hours is a tenth of the range: five times tighter than the daily setup. That is zero point six one of an R, on the index fund and on Bitcoin alike.
On Tesla, with its wide stop, the same move costs zero point one four. On Apple, zero point three.
Whatever edge a method has on a faster chart, it has to pay that first: on the index fund, more than half an R per trade before it breaks even.
That is the honest answer to the market is fractal. The pattern may scale. The bill does not.
So what can a daily chart answer? Three kinds of question.
Anything known before the trade: the cost in R, the size of the position, the room to the next level. That is arithmetic, and the timeframe does not change it.
Trades that live for days, where the order of events inside one bar rarely decides how they end.
And large differences: half an R and up, on a few hundred trades.
And three it cannot answer. Trades decided inside one day. Differences of a tenth of an R. And anything that depends on the order of the open, the high, the low and the close.
When you hear a claim, sort it first. A claim about intraday timing, tested on daily bars, has not been tested.
And a claim about a small edge, made on a few hundred trades, has not been tested either, whatever the chart.
Three limits on this video. One: I have no intraday data, so the cost scaling is arithmetic, not a measurement of any intraday method.
Two: the cost model is the channel's, five hundredths of a per cent a round trip on a stock and two tenths on crypto. A venue that charges less for limit orders changes the numbers, not the shape.
Three: the spread of one point three seven R comes from one setup. A setup with smaller swings would need fewer trades.
So, what to go and do. Ten minutes, with the instrument you actually trade.
Write down your stop in per cent of price, and your round trip from your broker's fee page. Divide one by the other. That is what every trade costs you in R, before it starts.
Then write down the edge you believe your method has, in R. If it is smaller than that cost, the method cannot work at that stop, on any chart.
No trades yet? This needs none: one number from a fee page, and one from a chart.
A daily bar answers questions about days. Educational content only. Nothing here is financial advice.
Educational content only. Nothing in this video is financial advice, a recommendation to buy or sell, or a promise of any result. Trading involves risk of loss. Do your own research. Risk warning.