How to Know Whether Your Version Works
 Video coming soon on YouTube
You changed something — a wider stop, a later entry, half off at the first target — and you want to know whether it works. This video is the rule for deciding that: how many trades to wait for, what counts as an answer, and when to stop looking.
The channel's rule is that a difference counts as measured at two of its error bars, and the error bar shrinks as the trades add up. On the 808 trades of the open-position video, one trade varies by 1.3R. To see a tenth of an R, three comparisons need very different numbers of trades: your average against a fixed number, 677 — six and a half years at two trades a week; two versions on different trades, 2,706 — twenty six years (the journal video got about 3,000 on its own trades); two versions on the same trades, like moving the stop to breakeven, 108 — about a year. Breakeven changed the outcome of only 144 of the 808 trades, and the other 664 ended the same to the cent, so the difference varies by 0.52R instead of 1.3R and needs twenty five times fewer trades.
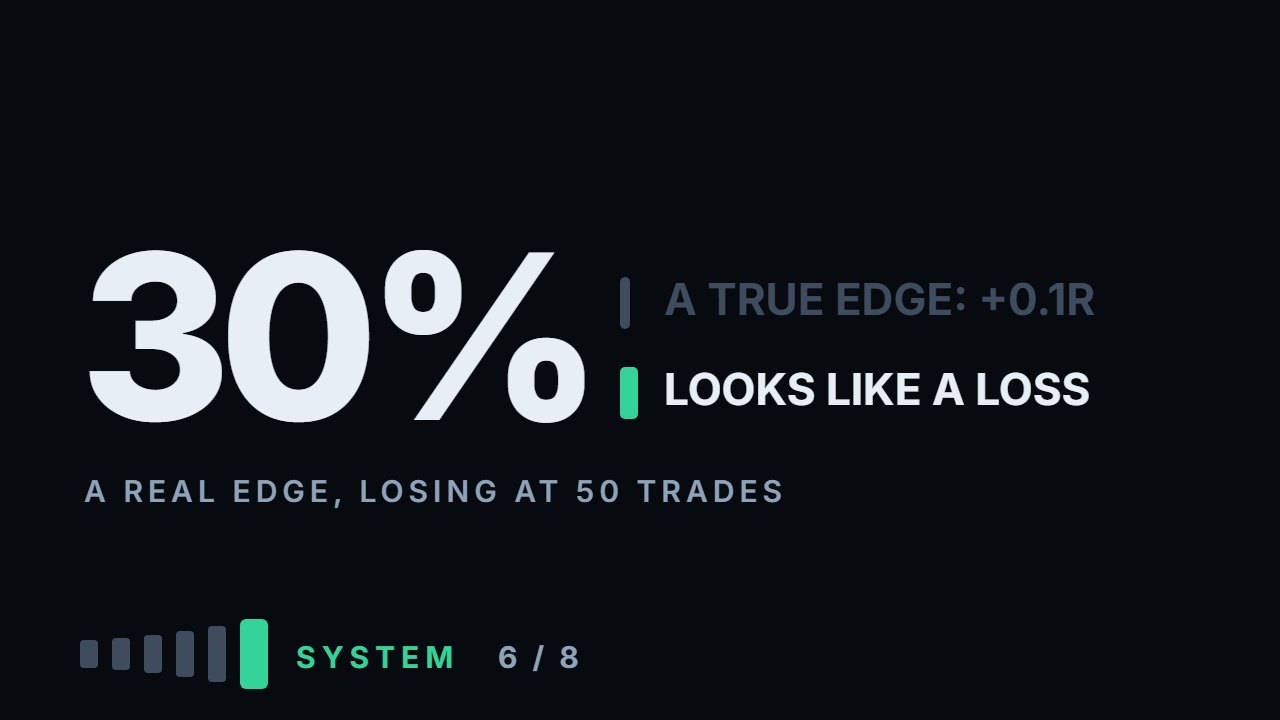
Two experiments on the same trades, resampled 20,000 times. A version with a true edge of +0.1R a trade showed a loss after 50 trades in 30% of the samples, after 100 in 22%, after 500 in 4%, and almost never only near a thousand. A version with no edge at all looked two error bars better in 1.9% of the samples when checked once after 300 trades, and in 11% when checked after every ten trades and stopped at the first good-looking result: about six times as often, with half of those false alarms in the first 50 trades. The rule: before the first trade, write down one change, the comparison, the difference worth the trouble and the number of trades; during, do not stop on a streak; at the end, two error bars or more is measured, and less means you keep the simpler version. Everything here is measured: the calculation ships with the video.
What to do with this
Take the one change you are most tempted to make. Write down whether it changes the entries or only what happens after them, and the difference that would make it worth doing. Compute the trades it needs — four times the spread squared, divided by the difference squared; on the same trades use the spread of the difference, on different trades take four times the result — and put the date you will reach that number in your calendar. No trades yet? Size the test now, with the course's spread of 1.3R.
Chapters
- 0:00How to know whether your version works
- 0:27The channel's rule: two error bars
- 1:03Three comparisons, three numbers of trades
- 2:17Why the same trades need so few
- 3:02A real edge can look like a loss
- 3:53Peeking: how a version with no edge gets proven
- 4:39The rule in three steps
- 5:23Three limits
- 5:56What to go and do
The calculation
Every number this lesson says out loud comes from the script below. results.txt is what it printed when the video was made.
Full transcript
You changed something. A wider stop, a later entry, half off at the first target. Now you want to know whether it works.
This video is the rule for deciding that: how many trades to wait for, what counts as an answer, and when to stop looking.
By the end you'll be able to take your own change and say, before the first trade, how many trades it needs to prove itself.
Start with the rule this channel uses for its comparisons. A difference counts as measured when it is at least two of its error bars.
The error bar depends on two things: how much one trade varies, and how many trades you have. More trades, a smaller bar.
On the eight hundred and eight trades of the open-position video, one trade varies by one point three R.
That is the noise a difference has to show through. How many trades that takes depends on what you compare.
There are three comparisons you will actually make. Your average against a number. Two versions on different trades. Two versions on the same trades.
The first: your average against a fixed number, zero, or a result a video published. To see a tenth of an R, that takes six hundred and seventy seven trades.
At two trades a week, six and a half years.
The second: two versions on different trades, a different entry or a different instrument. Each version brings its own noise, so a tenth of an R takes two thousand seven hundred and six trades.
Twenty six years. The journal video got about three thousand on its own trades: the same arithmetic, a slightly larger spread.
The third: two versions on the same trades. Same entries, same stops, only what happens after the entry differs. Like moving the stop to breakeven in the open-position video.
There, a tenth of an R takes one hundred and eight trades. About a year.
Why so few? Because most trades end the same either way.
Breakeven changed the outcome of one hundred and forty four trades out of eight hundred and eight. The other six hundred and sixty four ended the same, to the cent.
Those trades add no noise to the difference. So the difference varies by zero point five two R, not one point three.
The same tenth of an R, with twenty five times fewer trades.
So the first rule: where you can, test a change on the same trades. Keep the entries, change one thing after them, and for every trade write down what both versions would have done.
Now the part that hurts. Suppose your version really is better: a true edge of plus zero point one R a trade.
I took the real results of these trades, shifted so that their average is exactly plus zero point one, and drew samples from them twenty thousand times.
After fifty trades, the real edge showed a loss in thirty per cent of the samples. After a hundred, in twenty two per cent.
After five hundred, four per cent. Only near a thousand trades does it almost never look like a loss.
A real edge can spend its first hundred trades looking like nothing, or like a loss. Giving up on it there is not caution. It is reading noise.
The opposite mistake is easier to make. Suppose your version has no edge at all.
Look once, after three hundred trades, and it shows up two error bars better in one point nine per cent of the samples.
Check after every ten trades and stop the first time it looks proven, and it looks proven in eleven per cent.
About six times as often. And half of those false alarms come in the first fifty trades, exactly when stopping is most tempting.
Peeking turns a version with nothing in it into a discovery. That is the second rule: fix the number of trades before you start, and do not stop early on a good run.
So here is the whole rule, in three steps.
Before the first trade: write down one change and the comparison you will make, the size of difference worth the trouble, and the number of trades that difference needs.
During: log every trade, and do not stop on a good streak or on a bad one.
At the end: a difference of two error bars or more is measured. Less, and the change has not proved itself, so you keep the simpler version.
That last part matters. Not measured is an answer too. It says the change is too small to see at your number of trades, and too small to be worth the complication.
Three limits on this video. One: the spread comes from one setup. Yours may vary more or less, so compute it from your own log, and the numbers move with it.
Two: drawing samples treats trades as independent. Real trades come in streaks, and streaks make the true error bar wider, not narrower.
Three: two trades a week is an assumption. The trade counts hold at any pace; the years do not.
So, what to go and do. Take the one change you are most tempted to make.
Write down whether it changes the entries, or only what happens after them. Then write the difference that would make it worth doing.
Compute the trades it needs: four times the spread squared, divided by the difference squared. On the same trades, use the spread of the difference. On different trades, take four times the result.
Then put the date you will reach that number in your calendar, and do not judge the result before it.
No trades yet? Then this is the best moment: size the test before the first trade, with the course's spread of one point three R.
A version works when it beats its error bars, not when it feels right. Educational content only. Nothing here is financial advice.
Educational content only. Nothing in this video is financial advice, a recommendation to buy or sell, or a promise of any result. Trading involves risk of loss. Do your own research. Risk warning.