I Tested the Bounce Trade, One Decision at a Time
 Video coming soon on YouTube
The crypto-versus-stocks video measured the bounce trade and it lost money on all six instruments — so this one cannot be "how to trade the bounce". Instead it takes the bounce apart: entry, stop and exit are three separate decisions, and each one is measured on its own, on the same signals.
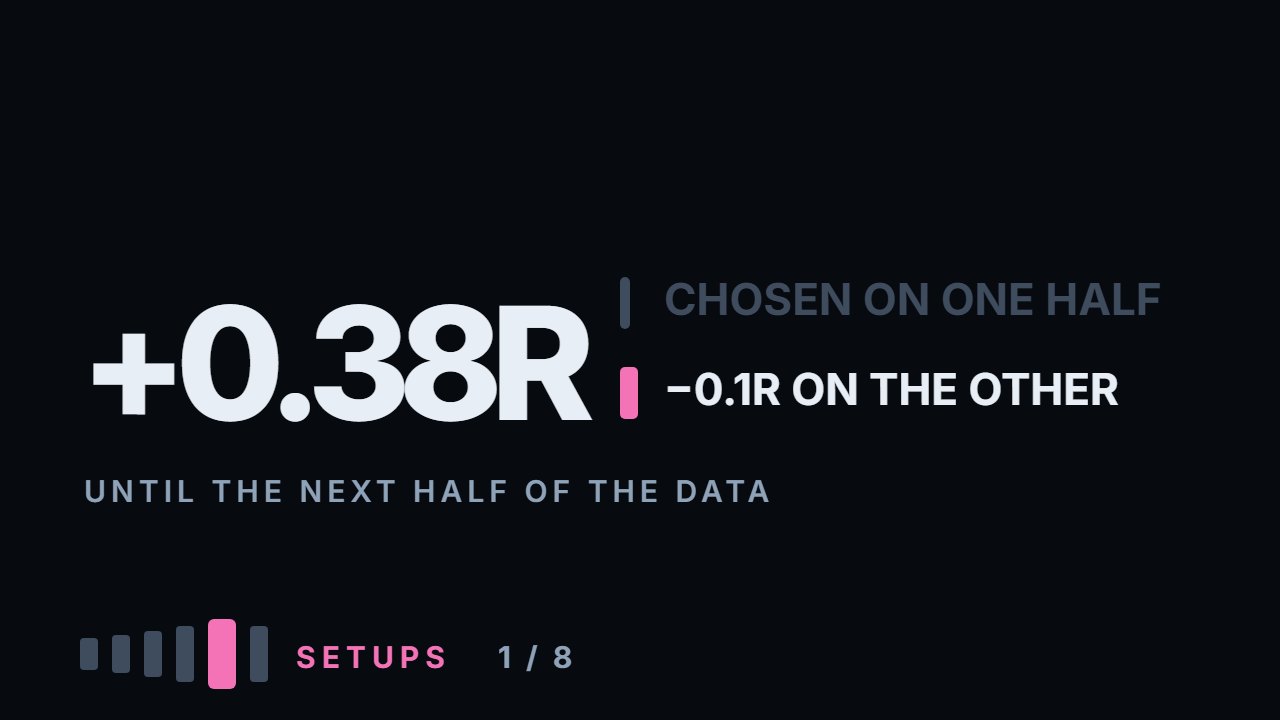
Entry at the touch averages −0.100R across every combination; waiting for the bar to close back and entering next morning averages −0.035R, helped by one of its stops that cannot exist with a touch entry. On the same stops confirmation is ahead in all nine pairs, −0.052R against −0.100R — but trade by trade the difference cannot be told apart from chance, and waiting costs half the signals. Among stop widths, once no trade can count a stop a few cents wide, half a daily range is the worst: −0.093R against −0.065R for one range and −0.070R for one and a half. A fixed 2R target is the worst exit of the three at −0.120R, worse than a time exit at −0.041R and a crude trail at −0.027R. One combination was impossible and said so clearly: entering at the touch with a stop behind the extreme of the touching bar returns exactly −1R on every one of 806 trades, because the extreme of a bar is only known once it closes. And then the part this video exists for: the best of the twenty-one combinations, chosen on the first half of the window, made +0.381R per trade over 174 trades — and the same rules on the second half returned −0.095R over 186. Similar samples, opposite sign — and while seventeen of the twenty one combinations did worse on the second half, the chosen one fell much further than the rest. One combination does stay positive over the whole window, +0.066R, and it loses 0.168R a trade after costs on the half that had no say in choosing it. That gap is the size of the illusion created by choosing the best of twenty. Everything here is measured: the calculation ships with the video.
What to do with this
Take your own rules and split your history in half. Tune anything you like on the first half — thresholds, filters, exits. Then run the tuned version on the second half, once, and do not tune again. Whatever that second number says is closer to the truth than anything you got from the first.
Chapters
- 0:00Three decisions nobody measures separately
- 0:21The three decisions inside a bounce
- 1:26Decision one: touch or confirmation
- 2:29What confirmation costs you
- 2:50Decision two: where the stop goes
- 3:44A combination that is logically impossible
- 4:43Decision three: how you get out
- 5:36The best combination of them all
- 6:07Splitting the window in half
- 6:47The same rules, the half that did not choose them
- 7:41What survives: directions, not settings
- 8:35Three limits
- 9:11The question to ask any strategy
- 9:26Go and do this
The calculation
Every number this lesson says out loud comes from the script below. results.txt is what it printed when the video was made.
Full transcript
A bounce trade is three separate decisions, and almost nobody measures them separately.
Measured whole, in the crypto-versus-stocks video, it lost money on all six instruments. Taken apart, it shows what each decision is worth, and what choosing the best combination does to you.
Where you enter. Where the stop goes. How you get out. By the end you'll be able to split your own history in half and see whether your best settings survive it.
Every one of those is usually inherited — from a course, a video, a habit. Here all three are measured, one at a time, on the same signals.
And the last section of this video is the one to stay for, because it is where a plus zero point three eight R strategy turns into a minus zero point one.
The raw material first. Every untested level, approached from the correct side, within three daily ranges of price.
That gives between ninety five and a hundred and seventy signals per instrument, over the same shared window. One touch per day per side: a single bar can graze three levels at once, and that is one decision, not three.
Decision one: the entry. Two options, and they are not close.
Option A, the one everybody draws: a limit order at the level. Price arrives, you are filled at your line.
Option B: wait. Let the bar that touched the level close back on the original side, and enter at the next day's open. That is the confirmed entry — not the confirmation of a level from the levels module, just a bar that closed back.
Across all combinations, the touch entry averages minus zero point one R. The confirmed entry averages minus zero point zero four — helped by one of its stops, behind the touch bar, which cannot exist with the touch entry.
Put both on the same stops and confirmation is still ahead, in all nine pairs: minus zero point zero five against minus zero point one.
Ahead every time — but by a margin that, trade by trade, cannot be told apart from chance. And waiting costs something: it throws away half the signals.
Eight hundred and eight trades become under four hundred. You pay in opportunity for a better fill.
Decision two: the stop. Half a daily range beyond the level, one, one and a half — or behind the extreme of the bar that touched. One rule throughout: no trade is allowed to count its risk as less than a quarter of a daily range — a stop a few cents from the entry would otherwise turn one lucky morning into a hundred R.
Half a range averages minus zero point zero nine. One range, minus zero point zero seven. One and a half, minus zero point zero seven.
Nothing dramatic: one daily range does a little better than a tight stop and about the same as a wide one — differences this sample cannot tell apart.
The bar-extreme stop looks best of all — but only in one specific pairing, and that needs a word.
Because one of these combinations is impossible, and the calculation said so in the clearest way it could.
Entering at the touch, with a stop behind the extreme of the touching bar, gave exactly minus one R on every single trade.
Not approximately. Exactly, all of them, on all six instruments.
Which is what a logical impossibility looks like in a backtest. The extreme of a bar is known when the bar closes. The touch entry happens inside that same bar.
So the stop was being placed behind a number that did not exist yet, and it was already hit at the moment of entry.
That combination is removed. If your rule needs a level that today's bar has not finished making, you do not have a rule.
Decision three: the exit. A fixed target at two stops, a time exit after ten days, or a trail — out on a close beyond the previous day's extreme.
The fixed target averages minus zero point one two. Time, minus zero point zero four. The trail, minus zero point zero three.
The direction is stable again: the fixed target is the worst of the three, and by a lot.
Which is worth pausing on, because a two-to-one target is the most repeated piece of advice in this business.
The reason it does badly here is mechanical. A target at two stops requires the move to keep going; a trail keeps whatever the move gave and leaves.
Now the part this video exists for.
Twenty something combinations. One of them is the best. It has to be — that is what happens when you compute twenty of anything.
The best one on the full window: enter on confirmation, stop behind the touch bar, trail the exit. Plus zero point one three R.
Positive. On three hundred and seventy five trades. That is the number a strategy video would end on.
So let us end it properly instead. Split the window in half.
Use the first half to choose the combination, exactly as a person would. Then measure that same combination on the second half, which had no say in the choosing.
On the first half, the winner was: confirmed entry, stop behind the touch bar, trailing exit. It made plus zero point three eight R per trade.
Almost four tenths of an R per trade, on a hundred and seventy four trades. That is not a good strategy. That is a fantasy.
On the second half, the same rules, the same instruments, the next stretch of time: minus zero point one R per trade, on a hundred and eighty six trades.
Similar sample size. Opposite sign. And it is not only the winner: seventeen combinations out of twenty one did worse on the second half.
But the winner fell much further than the typical combination, because the second half did not get a vote in picking it.
That gap — plus zero point three eight down to minus zero point one — is not a fact about bounces. Most of it is the size of the illusion you create by choosing the best of twenty.
And twenty is a small number. A real optimiser tries thousands.
So what survives all this? Two things, and they are not settings.
First: the direction of each decision, averaged over every combination. Trailing ahead of a fixed target, a stop of about one daily range ahead of a tighter one, and confirmation ahead of the touch on every shared stop. Hold them loosely: the disagreement video tests all three on these same signals, trade by trade, and not one of those differences is big enough for this many trades to tell apart.
Those are averages over every combination, which is a different kind of evidence than a single best number.
Second: none of it makes the bounce profitable on daily bars. The best honest average is still negative, which agrees with the crypto-versus-stocks video.
Three limits, briefly.
One: two years and nine months, and six instruments. A longer window would give more trades and might change the ranking of the small differences.
Two: all of this is before costs, and the crypto-versus-stocks video showed costs are worth between zero point zero three and zero point one two R.
Three: the trail is a crude one — the previous day's extreme. Better exits exist; measuring them is another video.
What to take away, if you take away one thing.
When you see a setup with numbers attached, ask which data chose the settings. If it is the same data the numbers come from, the numbers are decoration.
So, what to go and do. It takes an hour, and it is the most useful hour you will spend on any strategy you own.
Take your own rules and split your history in half. Tune anything you like on the first half — thresholds, filters, exits. No history yet? Take a rule from this course and a year of daily bars, and split those in half instead.
Then run the tuned version on the second half, once, and do not tune again.
Whatever that second number says is closer to the truth than anything you got from the first.
If that gap is large, it is a reason to change what you trade.
The best combination is not the best combination. It is the luckiest one. Educational content only. Nothing here is financial advice.
Educational content only. Nothing in this video is financial advice, a recommendation to buy or sell, or a promise of any result. Trading involves risk of loss. Do your own research. Risk warning.