I Tested Whether Obvious Levels Break Better
 Video coming soon on YouTube
The levels module measured a visible level — a sixty day extreme — on daily bars and could not tell it from an unremarkable one: it bounced about as often, and its fewer false breaks and further moves were only a lean. If that lean is real, it is bad news for a bounce and good news for a breakout, so the same feature should switch sign between the two trades. That is a prediction, not a hope, and this video tests it on real trades, with the same levels, the same window and the same accounting as the bounce video before it.
The prediction survives. Visible levels return +0.32R per trade before costs against −0.01R for unremarkable ones. Part of that gap is direction — visible levels break upward more often, and upward breaks did better in this window — but inside each direction visible still leads, by +0.34R upward and +0.24R downward: neither alone is beyond what this many trades can tell apart, together they just are. Entering the day after the close beyond the level averages +0.05R while waiting for the retest averages −0.09R — the retest never comes when the breakout is real, so waiting leaves you holding the ones that failed. A tight stop wins, the reverse of the bounce. A wide breakout bar is no different from an ordinary one on this sample: +0.04R against +0.07R, well within the noise. And settings chosen on the first half of the window returned −0.16R on the second half: the test that destroyed the bounce video destroyed this one too.
One finding rests on too few trades to call, and the counting is why it once looked like more. Two counting rules changed between the first version of this calculation and this one. First: a single close can sit beyond three swing lows at once, and that is one decision, not three — counting it three times makes the sample look three times more independent than it is. Second: if the next morning opens already beyond where the stop would go, there is no trade to take, and the calculation had been recording those as guaranteed losses. After both rules the sample went from 1064 trades to 667, and "a level tested twice or more breaks better" now rests on 34 trades at +0.19R against −0.01R for untested levels — too few trades to tell from zero. It is in this video as a warning, not as a result.
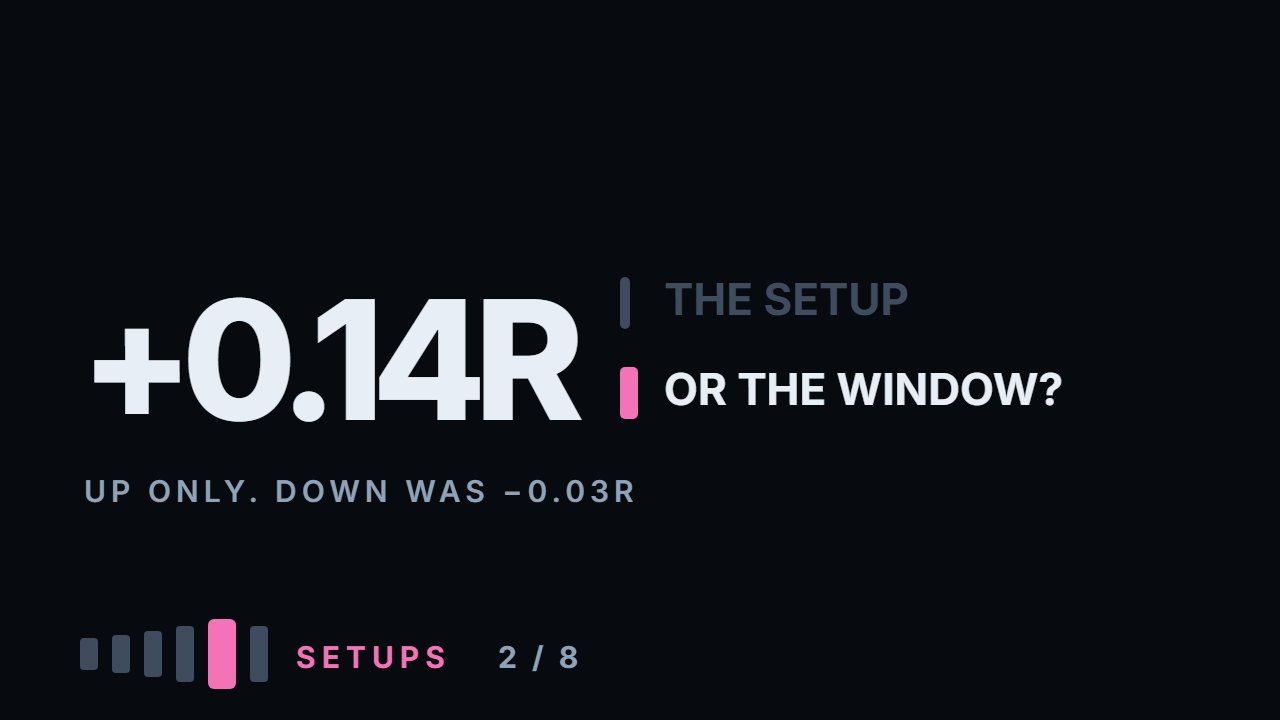
And then the split that matters. Every bit of the edge is on the long side: upward breaks +0.14R over 357 trades, downward breaks −0.03R over 310. Over two years and nine months in which six mostly rising instruments went up, an upward breakout is by construction a trade with the market. What got measured is not cleanly "does a breakout work" — it is closer to "does going with the direction of this window work". The visibility condition survives that, because it is compared inside each direction. The headline number does not. Everything here is measured, and the calculation ships with the video.
What to do with this
Take your last fifty trades and count how many of them came from the same day, or the same move on the same instrument. Then compute your average result twice: once per trade, and once per move. If those two numbers disagree, your record describes fewer independent decisions than you thought it did. That is not a reason to stop. It is a reason to know how many bets you have actually placed.
Chapters
- 0:00A prediction, not a hope
- 0:55What the levels module measured
- 1:27The signal, and two counting rules
- 2:30Decision one: next day, or wait for the retest
- 2:58What waiting actually costs
- 3:43Decision two: where the stop goes
- 4:22Decision three: the exit
- 4:49Now the conditions
- 5:13Visible levels only
- 5:44The condition that did not survive
- 6:08Too few trades to call
- 6:49The size of the breakout bar
- 7:34Choosing on one half, measuring on the other
- 8:10Split by direction
- 8:53A window with a direction
- 9:48Three honest limits
- 10:24Go and do this
The calculation
Every number this lesson says out loud comes from the script below. results.txt is what it printed when the video was made.
Full transcript
Everybody marks the obvious level and waits for price to bounce off it. The levels module could not tell obvious levels from the rest on daily bars, and left one tidy story untested: that they should break better. This is the test of that story, on real trades and the same accounting.
In the crypto-versus-stocks video the bounce trade measured negative on every instrument. The prediction this video was built to test survives. One of its findings rests on too few trades to call, and I nearly built half the video on it.
By the end you'll be able to count how many independent bets your record really holds. Start with why this was worth measuring, because it was a prediction, not a hope.
The levels module measured a visible level — a sixty day extreme — on daily bars. It bounced about as often as an unremarkable one, false breaks came out the same, and the further moves were only a lean — within what the data could tell apart.
If that lean is real, it is bad news for a bounce and good news for a breakout — so the same feature should switch sign between the two trades, and real trades can show it more clearly than bounce counts.
That is a testable claim, and this video tests it.
The signal: a close beyond a level that was a turn. First close only — a second break of the same line is a different event.
Then two counting rules, and both of them cost me numbers I liked.
One: a single close can sit beyond three swing lows at once. That is one decision, not three, and counting it three times makes the sample look three times more independent than it is.
Two: if the next morning opens already beyond where your stop would go, there is no trade. You cannot buy at a price that is already below your own stop. The calculation was taking those and recording a guaranteed loss.
After both rules, between eighty six and a hundred and thirty six breakouts per instrument, and six hundred and sixty seven trades in the base combination.
Then the same three decisions as last time. Where to enter, where the stop goes, how to exit.
Decision one, and it argues with the most common advice in breakout trading.
Option A: enter on the open of the day after the close beyond the level. Option B: wait for the retest — for price to come back to the level within five days — and enter there.
Everybody prefers the retest. It feels disciplined and it gives a tighter stop.
Measured: entering next day averages plus zero point zero five of an R across every combination. Waiting for the retest averages minus zero point zero nine.
Zero point one four apart, and the sign flips. Waiting also costs you a quarter of the signals — six hundred and sixty seven trades become four hundred and ninety nine.
Which makes sense once you say it plainly. If the breakout is real, the retest never comes, and you are left holding only the ones that failed.
Decision two: the stop. Half a daily range back inside the level, a full range, or behind the extreme of the breakout bar.
The tight stop wins here: plus zero point zero zero seven on average, against minus zero point zero two for the full range and minus zero point zero six for the bar extreme.
Note this is the reverse of the bounce, where the tighter stop was worse. A breakout that comes straight back is wrong immediately; a bounce needs room to be right.
Decision three: the exit. A trail averages plus zero point zero zero two, a time exit the same, a fixed target of two stops minus zero point zero seven.
The fixed target is the worst of the three, and the bounce video found exactly the same thing. Two setups, opposite in every other way, agree on that one.
Now the part this video exists for: the conditions. Base combination from here on — enter next day, stop a full range, exit on a trail.
Everything included, that base returns plus zero point zero six of an R per trade — positive, but small enough that six hundred and sixty seven breakouts cannot tell it from zero.
Now filter for visible levels only — the sixty day extremes.
Plus zero point three two of an R, on a hundred and forty eight trades. Against minus zero point zero one for the unremarkable ones, of which there are five hundred and nineteen.
That is the prediction confirmed, on real trades. The feature the levels module could only see leaning helps the breakout — measured on a different event with a different method.
Second condition, and this is the one I cannot call. How many times the level was tested before it broke.
Never tested: minus zero point zero one on four hundred and thirty two trades. Tested twice or more: plus zero point one nine — on thirty four.
Thirty four trades is a story, not a statistic. On my first pass the same slice had far more trades in it, and I believed it, and it was going to be the second half of this video.
The counting rule did not take it away — the gap is still there. A level tested twice sits inside a cluster of turns, and a cluster is exactly where one close breaks three levels at once.
Thirty four trades cannot tell plus zero point one nine from zero. It is not in this video as a result. It is in this video as a warning.
Third condition, and the one people are most sure about. The size of the breakout bar.
A wide breakout bar is supposed to mean conviction. Measured, it gives plus zero point zero four, against plus zero point zero seven for an ordinary bar — a gap well within what this many trades can tell apart.
So the conviction story finds no support here — and neither does its opposite.
Combine visible and ordinary and you keep the edge. Combine visible and wide and you get plus zero point five two on forty three trades — which is a story again, so I will not lean on it.
Then the half-window test: chosen on the first half, measured on the second.
Chosen on the first half: the retest, a tight stop, a time exit — plus zero point one of an R over two hundred and thirty one trades.
On the second half, the same rules: minus zero point one six, over two hundred and forty eight trades.
Same result as the bounce video: it did not hold.
What is left is the conditions, and here is the check that matters.
Split every breakout by direction. Upward breaks and downward breaks, counted separately.
Breaks upward: plus zero point one four of an R, over three hundred and fifty seven trades. Breaks downward: minus zero point zero three, over three hundred and ten.
All of the edge is in the long side. With the visibility filter both sides are positive — plus zero point three seven upward on a hundred and five trades, plus zero point one eight downward on only forty three. Forty three trades is a story and not a measurement, so the downward number is not one to lean on.
Now look at the window. Two years and nine months, from the end of 2023, on six instruments that mostly went up.
An upward breakout is by construction a trade in the direction of that rise.
So what got measured here is not cleanly "does a breakout work". It is closer to "does going with the direction of this window work" — and it did, because the window had a direction.
That does not erase the conditions. Visible beats unremarkable within each direction — by a third of an R upward and a quarter downward. Neither alone is beyond what this many trades can tell apart; together they just are. And that comparison is internal to the sample, so the window cannot explain it.
But the base number — plus zero point zero six across every breakout — should be read as a measurement of a rising market at least as much as of a setup.
Three honest limits, and the first is the one just described. A falling window would very likely reverse the sign, and I cannot test that here.
Two: all of it is before costs, which the risk module measured at zero point zero three to zero point one two of an R per round trip. That is more than most of the numbers in this video.
Three: first breaks only. If you trade the second and third attempt on the same level, none of these numbers describe your trading.
So, what to go and do. It takes about an hour.
Take your last fifty trades and count how many of them came from the same day, or the same move on the same instrument. No trades yet? Take fifty signals from a chart six months back, as if you had traded them, and run the same count.
Then compute your average result twice: once per trade, and once per move. If those two numbers disagree, your record describes fewer independent decisions than you thought it did.
That is not a reason to stop. It is a reason to know how many bets you have actually placed.
The breakout came out slightly positive, its one condition that holds is visibility, and most of the rest was the window. Educational content only. Nothing here is financial advice.
Educational content only. Nothing in this video is financial advice, a recommendation to buy or sell, or a promise of any result. Trading involves risk of loss. Do your own research. Risk warning.