What's on the Screen Before the Session
 Video coming soon on YouTube
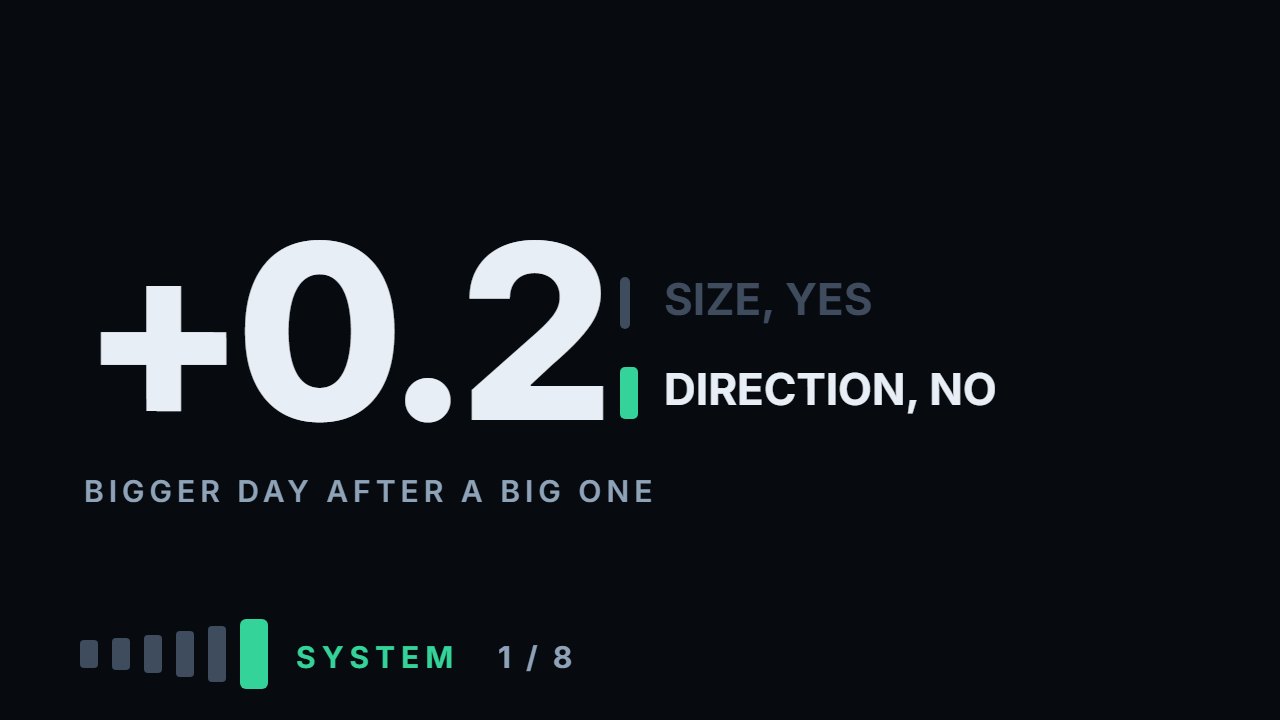
Before the market opens you can already see yesterday's bar, the gap, where price closed inside its recent range, whether yesterday closed above the day before, and what day it is. Every course treats that screen as preparation, and preparation is supposed to decide more than anything you do inside the session. This video measures what the screen can actually tell you, and the answer splits cleanly in two: a trading day has a size and a direction, and the pre-open screen answers exactly one of them.
Size first. Measured as today's range divided by the median range of the twenty sessions before it, so every feature is known before the open and the numbers compare across Apple, Tesla, an index fund, Bitcoin, Ethereum and Solana. After a day that was bigger than usual, today is bigger too: on Apple the median range goes from 0.93 to 1.10, and the same measurement is positive on all six instruments, median +0.20 of a daily range. Not large, but the most consistent result in the video, and it survives the split — +0.22 on the first half of the window, +0.19 on the second. The gap is second and smaller, +0.13, on the three instruments that actually close overnight. Where price sits in its twenty day band depends on the instrument: the median is +0.07, but on the index fund a close low in the band means a bigger day, by 0.39, on both halves of the window, and on Tesla, Ethereum and Solana it goes the other way.
Direction is the other half, and it is where the screen stops working. Across six instruments between 49 and 53 percent of days close up — that is the coin every feature has to beat. Yesterday's range was large: +0.4 percentage point. Price high in the band: −0.7. Yesterday closed above the day before: −3. The gap went up: −0.1. Not one is outside the noise, and three of the four point the wrong way from the story usually told about them. The only number that looks like anything is gap size at +4.6 points on three instruments, which is what a coin does when you flip it in small groups.
The control is the day of the week — for direction, a feature with no mechanism. (For size it is not empty: on the coins a Saturday is little more than half a normal day, so the weekend stays out of the control.) Its weekday ranges sit between 0.99 and 1.11, and its direction runs from Thursday at 44 percent up to Monday at 54. Thursday is the largest direction effect in this entire video, and it is meaningless by construction. That is the calibration: a feature that moves direction by less than the weekday does is not moving direction. What is left is worth having anyway — the screen sizes your day, your stop is measured in daily ranges, and after a large day the same rule asks for a wider stop and a smaller position. The wider next day is measured, on six instruments out of six; resizing the stop for it is a decision you can make before the open, and a reason to adjust, not a source of profit.
What to do with this
Take the last 250 sessions of the instrument you actually trade and divide each day's range — high minus low — by the median range of the twenty sessions before it. Compare the median of the days that followed a large day with the median of the days that followed a quiet one. If the first is bigger, your instrument does what these six do — on these six it was, in every 250-session stretch — and your stop needs to widen after a big day rather than stay where it was. Then do the same for direction: the days after an up day against the days after a down day. If you find something there, treat it as noise until it survives a few hundred more days; this video used six hundred to a thousand per instrument, and direction did not move.
Chapters
- 0:00What the screen shows before the open
- 0:35A day has a size and a direction
- 0:59The two things you want to know
- 1:13The one feature not known before the open
- 1:25Size first, and the unit
- 1:41After a quiet day, after a big one
- 1:59The same measurement on six instruments
- 2:32The gap
- 2:55Where price sits in its band
- 3:39Both size results survive the split
- 4:09Direction, and the coin to beat
- 4:35Four features against direction
- 5:07The one that looked like something
- 5:30The control: the day of the week
- 6:25Thursday, the largest direction effect here
- 6:44Sizing the day, not calling it
- 6:57One daily range is not a fixed number of dollars
- 7:50What it does not let you do
- 8:01Three limits
- 8:38Go and do this
- 9:38The routine that follows
The calculation
Every number this lesson says out loud comes from the script below. results.txt is what it printed when the video was made.
Full transcript
Before the market opens you can already see quite a lot. Yesterday's bar, the gap, where price sits in its recent range, what day it is.
The usual claim is that preparation decides more than anything you do inside the session. This video measures what that preparation can actually tell you.
And the answer splits cleanly in two, which is the whole point of the video. By the end you'll know what the screen before the open can tell you about the day, and what it cannot.
A trading day has a size and a direction. Those are two different questions, and the screen before the open answers exactly one of them.
Five things you can see before the open. Yesterday's range. The gap. Where price closed inside its twenty day band. Whether yesterday closed up. And the day of the week.
Two things you want to know about today. How big it will be, and which way it will go.
Every feature here is known before the open, with one exception, and I will name it rather than hide it.
The gap is known at the open, not before it. It is the only thing taken from today's bar, and it is the one a real person genuinely does see on the screen.
Start with size. The measure is today's range divided by the median range of the twenty sessions before it, so the numbers are comparable between Apple and Bitcoin.
First feature: yesterday's range was bigger than usual.
On Apple, days after a quiet day have a median range of zero point nine three. Days after a large one, one point one.
That is plus zero point one seven of a daily range, and it is not an Apple quirk.
Tesla plus zero point one four. The index fund plus zero point two nine. Bitcoin plus zero point one six. Ethereum plus zero point two four. Solana plus zero point two seven.
Six instruments, six positive, median plus zero point two. Not large, but real: on every one of the six it is well beyond what this many days can tell apart, and both halves of the window agree.
Second feature: the gap. On days that open more than a quarter of a range away from yesterday's close, today's range is bigger by zero point one three.
Three instruments only, because the coins trade through the night and a real gap almost never happens on them. That limitation is the reason, not a small sample.
Third feature: where price sits in its twenty day band. High in the band, low in the band.
Median difference across six instruments: plus zero point zero seven of a daily range. But the median hides a split. On the index fund, a close low in the band means a bigger day, by zero point three nine of a range, on both halves of the window. On Tesla, Ethereum and Solana it goes the other way.
So of three things you can see, two tell you something about size wherever they can be measured, and the third depends on the instrument.
And both of the two survive the split. Yesterday's range gives plus zero point two two on the first half of the window and plus zero point one nine on the second.
The gap gives plus zero point one three and plus zero point one four. Small, but the same on both halves.
Which is a genuinely useful result, and this channel has not had many of them. Now the other half.
Direction. Same features, same days, and the question is only whether today closes above its open.
The base rate first, because without it every number below is meaningless. Across the six instruments, between forty nine and fifty three percent of days close up.
That is the coin. Every feature has to beat the coin.
Yesterday's range was large: median difference plus zero point four of a percentage point.
Price high in the band: minus zero point seven. Yesterday closed above the day before: minus three. The gap went up: minus zero point one.
Not one of them moves direction by more than the day of the week does, and you will see that control in a minute. Three of the four also point the wrong way from what they are supposed to mean.
The gap size is the only one that looks like anything: plus four point six points, on the three stocks.
Four point six points on three instruments is not a finding. It is what a coin does when you flip it in three rooms.
So the same screen that predicts the size of today predicts nothing about its direction.
Now the control, and I put it in because it is the only way to know what "nothing" looks like.
The day of the week. For direction, a feature with no mechanism at all.
Median range: Monday one point one one, Tuesday zero point nine nine, Wednesday one point zero three, Thursday one point zero five, Friday one point zero six. For size the calendar is not empty: on the coins a Saturday is little more than half a normal day. So weekends stay out of this control, and they belong on your screen.
Direction: Monday fifty four percent up, Tuesday forty nine, Wednesday fifty one, Thursday forty four, Friday fifty three.
Thursday at forty four percent is the largest direction effect in this entire video. It is also completely meaningless.
That is the calibration. If a real feature moves direction by less than the day of the week does, the feature is not moving direction.
So what does this leave a person doing before the open?
It leaves you sizing the day, not calling it. And that is not a consolation prize — it is the more useful of the two.
Your stop is measured in daily ranges. This channel measures stops in that unit, and it is what makes Apple and Solana comparable at all.
But "one daily range" is an average of twenty days, and one large day barely moves it — while the next day tends to be larger. So after a large day, widen the stop yourself, and shrink the position to keep the risk equal.
After a large day the next one is, measured, about a fifth of a daily range wider than after a quiet one, on six instruments out of six. That is a reason to resize the stop, not a source of profit.
And it is a decision you can make before the open, from information that is already on the screen.
What it does not let you do is decide which way to face. Nothing here does that: not one candidate moves direction more than the day of the week.
Three honest limits. One: daily bars only. A session has a shape inside it, and none of that is visible here.
Two: the gap result covers three instruments, because the other three do not close. That is a property of the market, not a gap in the method, but it is still only three.
Three: one window, two and a half years, mostly rising. The size result is about volatility and should be sturdier than a direction result would be, but I cannot prove that here.
So, what to go and do. It takes about fifteen minutes tonight and then two minutes a day.
Take the last two hundred and fifty sessions of the instrument you actually trade. Divide each day's range by the median of the twenty sessions before it.
Then compare the median of the days that followed a large day with the median of the days that followed a quiet one.
If the first is bigger, your instrument does what these six do — on these six it was, in every stretch of that length — and your stop needs to be a different size on those mornings.
Then do the same for direction: compare the days after an up day with the days after a down day.
If you find something there, treat it as noise until it survives a few hundred more days. This video used six hundred to a thousand days per instrument, and direction did not move.
The routine that follows is short. Before the open: how big was yesterday, is there a gap, and therefore how wide is my stop and how small is my position.
That is the whole of what the screen can give you, and it is worth having. The rest of the morning routine is a ritual, and rituals are fine as long as you know which part is which.
The screen before the open tells you the size of the day and nothing about its direction. Educational content only. Nothing here is financial advice.
Educational content only. Nothing in this video is financial advice, a recommendation to buy or sell, or a promise of any result. Trading involves risk of loss. Do your own research. Risk warning.