I Tested Moving the Stop to Breakeven and Taking Half Off
 Video coming soon on YouTube
Between the entry and the exit there is a stretch the course had not measured: the days the trade is open. Move the stop to breakeven, take half off, let the rest run — this video runs all of them on the same 808 bounce trades from the first video of the setups module: entry at the touch of an untested level, a stop one daily range beyond it, a target two stops away, out after ten days. On the day of entry only the stop counts, a stop and a target on the same day count as the stop, and a stop moved to breakeven works from the next morning, because on a daily chart you learn that the trade passed one R at the close.
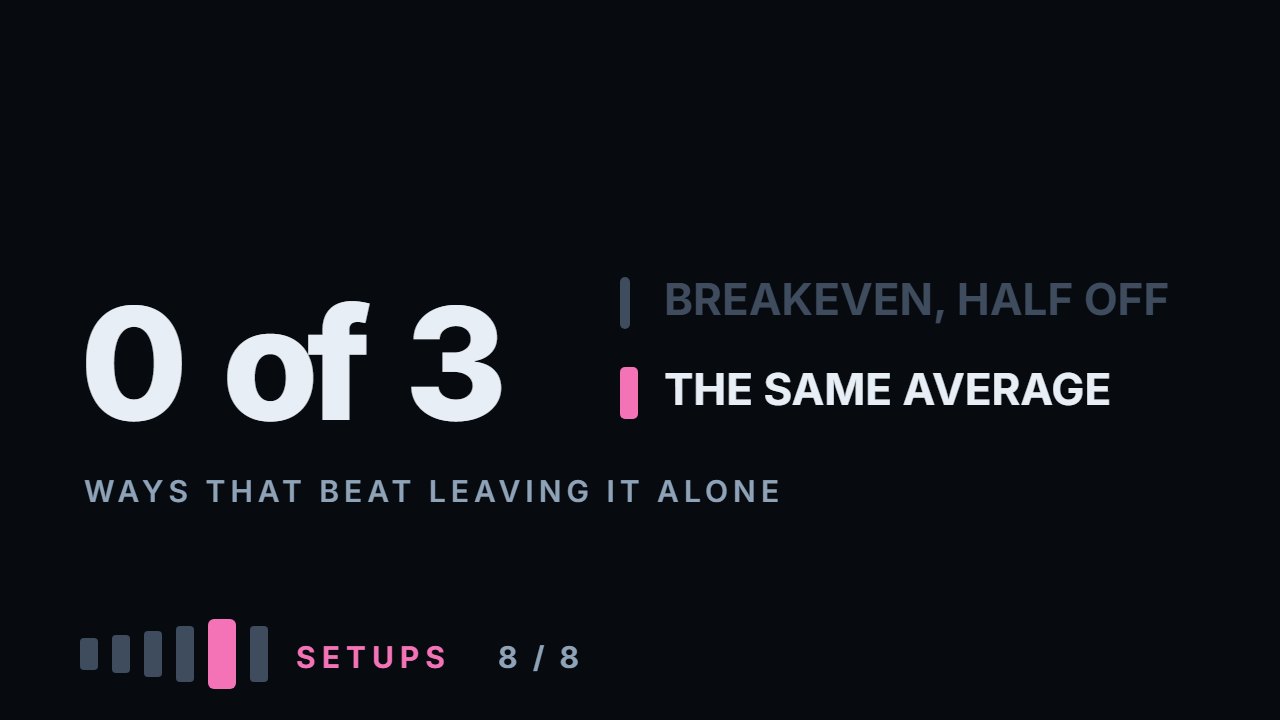
Leaving the trade alone: −0.13R a trade, 31% of trades in profit. Breakeven after +1R: −0.12R, only 25% in profit, because 144 trades now end at exactly zero. Half off at +1R: −0.14R, 33% in profit. Half off and the rest at breakeven: −0.13R — and 43% in profit. The same average with twelve more winners in a hundred, each of them smaller: the average win falls from 1.73R to 1.01R. Measured trade by trade against leaving it alone, breakeven is +0.013R with an error of 0.018, half off −0.007 with an error of 0.015, both together −0.001 with an error of 0.022 — not one clears two error bars, and the two halves of the window agree. Of the 339 trades that went one R into profit, breakeven saved 94 of them, by 0.91R on average, and cost 50 of them, by 1.5R on average. Close to nothing, net. What it reliably changes is how the results feel. Everything here is measured: the calculation ships with the video.
What to do with this
Take every trade where you moved the stop or took part of the position off, and write down what it would have done if you had left it alone. Compare the average result your way with the average untouched — not the win rate, the average. If they are the same, your management is buying you a feeling; decide on purpose whether that feeling is worth it.
Chapters
- 0:00The stretch between the entry and the exit
- 0:27The trades, and four ways to run them
- 1:29The accounting
- 1:55The results
- 2:32The same average, more winners
- 3:11Measured trade by trade
- 4:13Where breakeven pays and where it costs
- 5:14What it really changes
- 5:46Three limits
- 6:19Go and do this
The calculation
Every number this lesson says out loud comes from the script below. results.txt is what it printed when the video was made.
Full transcript
Between the entry and the exit there is a stretch this course has not measured yet: the days when the trade is open and you are watching it.
Move the stop to breakeven. Take half off. Let the rest run. Every course has an opinion about what to do in that stretch.
By the end you'll know what each of those does to your results, and what it only does to how your results feel.
The trades are the bounce trades from the first video of this module: eight hundred and eight touches of an untested level, on six instruments.
The settings are the middle ones from that video. Entry at the touch, a stop one daily range beyond the level, a target two stops away, and out after ten days.
Four ways to run the same trades. A: leave it alone.
B: once price has gone one R your way, move the stop to the entry. Breakeven.
C: once price has gone one R your way, take half the position off there, and let the other half run.
D: both. Half off at one R, and the rest at breakeven.
Same entries, same days, same prices. The only thing that differs is what happens after the trade has moved one R in your favour.
One rule of accounting, the same as everywhere in this module: on the day of entry only the stop counts. And when the stop and the target fall on the same day, it is the stop.
And one more for this video: a stop moved to breakeven takes effect the next morning. On a daily chart you find out the trade passed one R at the close.
Now the results. Leaving it alone: minus zero point one three of an R a trade, with thirty one per cent of trades ending in profit.
Breakeven: minus zero point one two. But only twenty five per cent end in profit, because a hundred and forty four trades now end at exactly zero.
Half off: minus zero point one four, with thirty three per cent in profit.
Half off and breakeven: minus zero point one three, and forty three per cent of trades in profit.
Look at that last one. The same average as leaving it alone, and twelve more trades in a hundred ending in profit.
The average win shows where they came from. Leaving it alone, a winning trade makes one point seven three R. Half off and breakeven, one point zero one.
Twelve more winners, each of them smaller. That is the exchange every management rule makes: how often you win, against how much.
The first video in this course was about exactly this: a win rate on its own decides nothing.
Now measure it properly: each method against leaving it alone, trade by trade, because they run on the same trades.
Breakeven: plus zero point zero one three of an R, with an error of zero point zero one eight. Less than one error bar.
Half off: minus zero point zero zero seven, error zero point zero one five. Half off and breakeven: minus zero point zero zero one, error zero point zero two two.
Not one of the three clears two error bars. On eight hundred and eight trades, managing the position in the usual ways did not change the average, in either direction.
The two halves of the window agree. Breakeven is a little ahead on both, by less than its error each time. Half off is behind on one half and ahead on the other.
So breakeven is not free, and it is not a gift either. Here is where it pays and where it costs.
Three hundred and thirty nine of the trades went one R into profit at some point. Forty two per cent.
For ninety four of them, breakeven helped. Price came back through the entry, and instead of a full loss the trade closed at zero. On average it saved zero point nine one of an R.
For fifty of them, it hurt. Price came back to the entry, took the stop, and then went on toward the target without the position. On average that cost one and a half R.
Ninety four small saves against fifty large misses. Net, close to nothing.
And for the other one hundred and ninety five it changed nothing: the trade reached the target, or ran out of time, without touching the entry again.
What breakeven reliably changes is how it feels. More trades end without a loss, a hundred and forty four of them at exactly zero, and fewer end with a win.
If that feeling is what keeps you following your rules, it is worth something. That is a reason, not a measurement, and it is fine to say so.
But if you move the stop because it feels like protection, know what it buys: on this data, nothing on average.
Three limits. One: daily bars. An intraday trader moves the stop the moment price passes one R, not the next morning, and could get different numbers.
Two: one setup, and a losing one. On a setup with an edge, how you manage the winners could matter more.
Three: one R as the trigger. A different trigger would give different numbers, and I chose one R before measuring, not after.
So, what to go and do. Twenty minutes on your own record.
Take every trade where you moved the stop or took part of the position off. For each one, write down what the trade would have done if you had left it alone.
No trades yet? Take twenty setups from a chart six months back, and run both versions on each.
Then compare two numbers: the average result your way, and the average result untouched. Not the win rate. The average.
If they are the same, your management is buying you a feeling. Decide whether that feeling is worth it, on purpose.
Management changes how often you win, not how much you make. Educational content only. Nothing here is financial advice.
Educational content only. Nothing in this video is financial advice, a recommendation to buy or sell, or a promise of any result. Trading involves risk of loss. Do your own research. Risk warning.