I Tested Three Ways to Trade the Same Level
 Video coming soon on YouTube
The same event — price arriving at a level — can be traded three completely different ways, and people argue about which one is right. This video replaces the argument with a measurement: the same 783 touches, six instruments, two and three quarter years, and three sets of rules. No names attached, because what matters is the machinery. The fast way enters at the touch with half a daily range of stop and takes one stop of profit, out within two days. The middle way waits for the bar to close back off the level, stops a full range away, targets three stops. The slow way stops two ranges away and trails the exit.
Start with what each way demands rather than what it returns. The fast way asks for a decision forty eight times a year per instrument; the other two, twenty three each. Median time in position is one day, five days and three days — and that last one is the surprise, because a style built for thirty days exits in three the moment a trailing exit takes it out on a daily close. Win rates are close at 33, 35 and 39 percent. Take the single best trade out of each style and none of them changes: no style here rests on one lucky day.
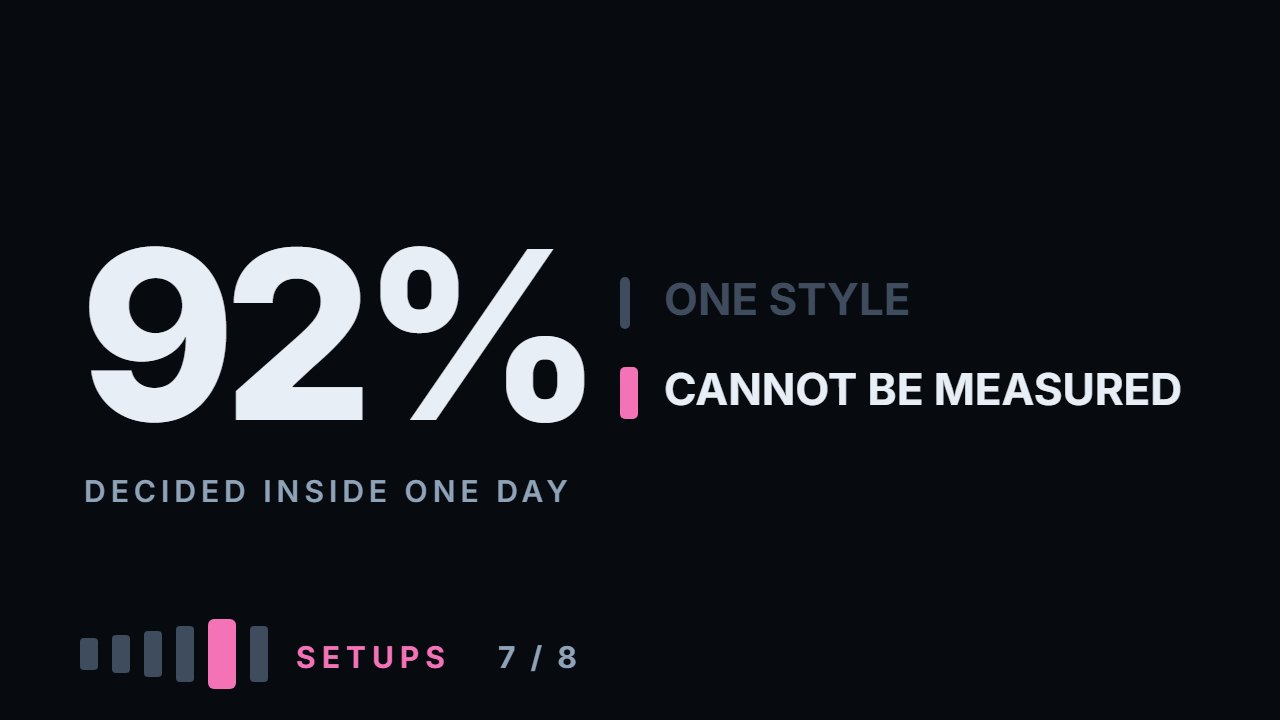
The results are two numbers and one non-answer. The middle way returns +0.005R per trade, which is zero with extra decimal places. The slow way returns −0.05R. The fast way returns −0.34R, and that number is an artefact of my own accounting rather than a measurement. This channel counts the stop on the day you enter and refuses to count the target, because four numbers a day do not say what happened first inside the day. For a trade held for weeks that rule costs nothing. For the fast way, 92 percent of trades are over within one day of entry; 32 percent touch both the stop and the target on the entry day, and another 49 percent touch the target without touching the stop that day. Counted the worst way it makes −0.34R. Counted the best way it makes +0.70R. A spread of more than a full R on the same trades, and the honest answer is the whole range.
Which means this data cannot measure the fast way. Not "it loses" — cannot measure. That is true of every backtest of a short-horizon style computed from daily candles, including every one you have been shown. On the out-of-sample half the two styles that can be measured are both negative: −0.12R and −0.11R. So the ranking that matters is not edge. It is this: the slow way you can check, the middle way you can check, the fast way you cannot, on any data most people have. Everything here is measured, and the calculation ships with the video.
What to do with this
Open your own trade log and write down how long you held each trade in days, then take the median. That number is your actual style, and it is very often not the one you believe you trade. Then count how many trades opened and closed on the same day. If that share is large, no daily-bar test — mine or anyone's — describes what you do, and you need your own records instead.
Chapters
- 0:00Three ways, one event
- 0:32The three sets of rules
- 1:26What each way demands of you
- 1:48Time in position, and one surprise
- 2:22Win rates, nearly identical
- 2:40Does any of it rest on one trade
- 3:26Two results and one non-answer
- 4:02Why the fast number is wrong
- 4:29What the entry day actually contains
- 5:01Counted both ways
- 5:28The data cannot measure this
- 5:57The two styles that can be measured
- 6:19Choosing on one half, measuring on the other
- 7:00So which one
- 7:45Three limits
- 8:32Go and do this
The calculation
Every number this lesson says out loud comes from the script below. results.txt is what it printed when the video was made.
Full transcript
The same event — price arriving at a level — can be traded three completely different ways. People argue about which one is right.
That argument is empty, and this video replaces it with a measurement. Same signals, three sets of rules, and a look at what each one costs.
No names attached. What matters is the machinery, not who taught it. By the end you'll know which of the three ways your own record can actually measure.
The fast way: enter at the touch, stop half a daily range beyond the level, take one stop of profit, out within two days.
The middle way: wait for the bar to close back off the level, enter next morning, stop a full range, target three stops, up to ten days.
The slow way: same confirmed entry, stop two full ranges, no fixed target, trail the exit, up to thirty days.
Same seven hundred and eighty three touches, on six instruments, over two and three quarter years. Nothing about the market changes between the three — only the rules.
And one number that comes out of this before any of the results, which turned out to be the important part of the video.
Start with what each way demands of you, because that is what actually differs.
The fast way trades forty eight times a year per instrument. The other two, twenty three each.
Twice the decisions, twice the executions, twice the chances to deviate from your own rules — before you have measured whether it is worth anything.
Time in position: the fast way is out in a day at the median. The middle way holds five days. The slow way, three.
That last one is the surprise. A style built for thirty days exits in three, because a trailing exit takes you out at the first daily close through yesterday's extreme.
So "slow" describes the intention, not the behaviour. The rule you wrote decides how long you hold, not the label you gave it.
Win rate: thirty three percent for the fast way, thirty five for the middle, thirty nine for the slow.
Nearly identical, and all three mean the same thing in practice: you will be wrong roughly two times in three, whichever way you choose.
Now concentration, which is the check that decides whether a result is repeatable at all.
Take the single best trade out of each style. If the average collapses, the result belonged to one lucky day and not to the method.
The fast way: minus zero point three four, and minus zero point three four without its best trade. The middle way: plus zero point zero zero five, and minus zero point zero zero three.
The slow way: minus zero point zero five, and minus zero point zero six. No style here rests on one trade.
Now the results, and one of them is not a result at all.
The middle way returns plus zero point zero zero five of an R per trade. That is zero with extra decimal places.
The slow way returns minus zero point zero five. Also, effectively, nothing — a small negative.
The fast way returns minus zero point three four, and that number is wrong. Not slightly wrong. It is an artefact of my own accounting, and here is how I know.
The rule of this channel is that on the day you enter, the stop counts and the target does not.
That rule exists because four numbers a day — open, high, low and close — do not say what happened first inside the day.
For a trade held for weeks, that rule costs almost nothing. For a trade that lives inside a single day, it decides everything.
Measured: ninety two percent of fast-way trades are over within one day of entry.
And on the day of entry itself, thirty two percent of them touch both the stop and the target. For those, daily bars simply do not contain the answer.
Another forty nine percent touch the target on the entry day without touching the stop that day — and my rule refuses to count those, because it cannot tell a same-day target from a same-day illusion.
So I ran it both ways. Worst case, where a same-day target never counts: minus zero point three four.
Best case, where a same-day target always counts: plus zero point seven.
That is a spread of more than a full R on the same seven hundred and eighty three trades, and the honest answer for the fast style is that entire range.
Which means: this data cannot measure the fast way. Not "it loses". Cannot measure.
And that is worth more than any of the three numbers, because it is true of every backtest of a short-horizon style ever shown to you on daily candles.
If someone shows you a day-trading result computed from daily bars, they have made this choice too. Ask them which way, and watch what happens.
Back to the two styles that can be measured. Across instruments, the middle way is positive on four of six and negative on two.
The slow way is positive on two and negative on four. Neither is consistent, and both are close enough to zero that the sign is noise.
Then the half-window test.
The middle way was best on the first half: plus zero point one four over a hundred and eighty one trades.
On the second half, the same rules: minus zero point one two over a hundred and ninety four.
Fourth time in five videos, the best did not survive the half that did not pick it.
And on that second half, the same thing holds: this data cannot measure the fast way. The middle, minus zero point one two. The slow, minus zero point one one. Both negative.
So what is the answer to the title. Three ways to trade the same level — which one?
On this data, the two styles that can be measured make nothing from the level itself, and the third cannot be measured at all. The differences between them are not differences in edge.
They are differences in what the style costs you: how many decisions a year, how long your capital is tied up, and how much of it you can even verify.
That last one is the real ranking. The slow way you can check. The middle way you can check. The fast way you cannot, on any data most people have access to.
Three limits. One: three styles is three points, not a survey. A different stop or a different target would give different numbers, and I chose these before measuring, not after.
Two: everything is before costs. A round trip costs the fast way zero point zero three to zero point one two of an R, the wider stops of the other two pay less of an R for the same trip — and at forty eight trades a year the fast way pays it twice as often.
Three: one window, six instruments, two and three quarter years, mostly rising. The same caution as every video here.
So, what to go and do. It takes about twenty minutes and it is not a backtest.
Open your own trade log and, for every trade, write down how long you held it in days. No trades yet? Take twenty setups from a chart six months back, and for each one count the days until price reached your stop or your target.
Then take the median. That number is your actual style, and it is very often not the one you believe you trade.
Then count how many of your trades opened and closed on the same day.
If that share is large, no daily-bar test — mine or anyone's — describes what you do. You need your own records, and now you know exactly why.
Three ways to trade one level. Two measured close to zero, and one could not be measured at all. Educational content only. Nothing here is financial advice.
Educational content only. Nothing in this video is financial advice, a recommendation to buy or sell, or a promise of any result. Trading involves risk of loss. Do your own research. Risk warning.