How Far It Moves, and Why Two Measures Disagree
 Video coming soon on YouTube
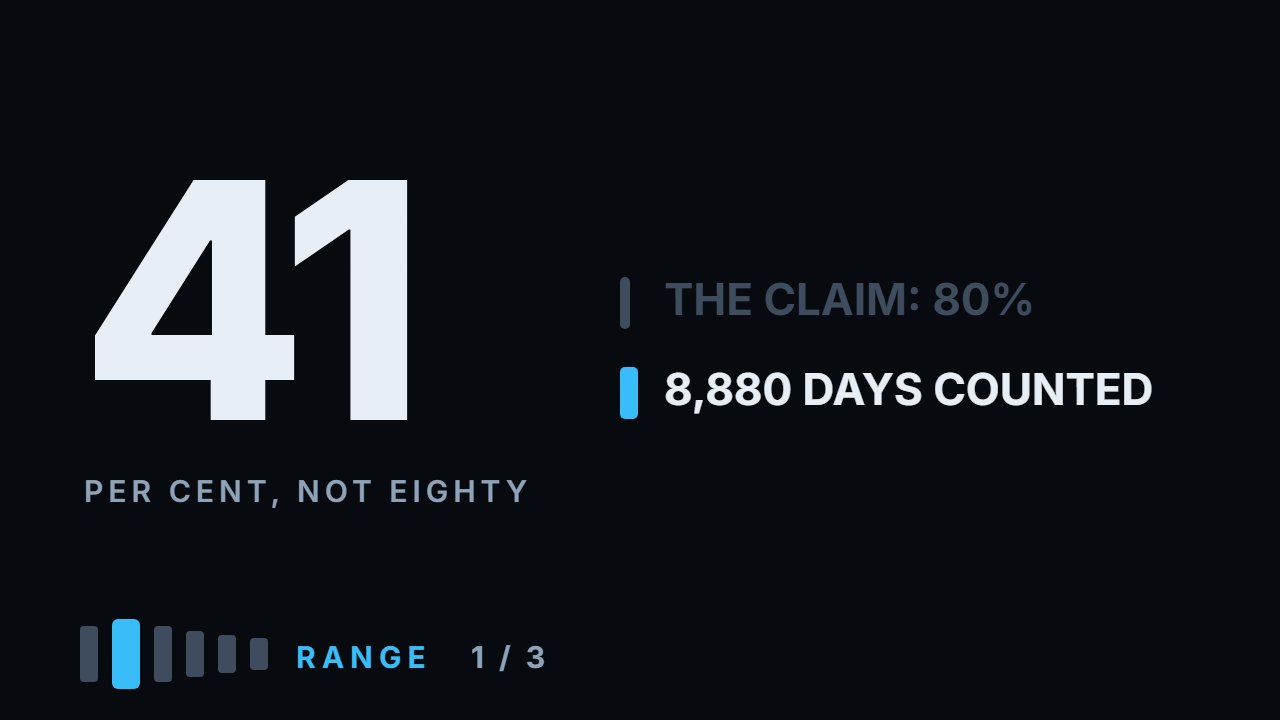
Eighty per cent of the time, an instrument travels one ATR. Every course repeats it, usually with a picture of a car and a full tank of fuel. I counted 8,880 days across six instruments to see what actually happens.
The number is real. The sentence attached to it is not. Under the natural reading it comes out at 41 per cent, not 80 — and the 84 that does exist belongs to a different definition, one the same teaching gives and never connects to the number. The fuel tank turns out to be backwards as well.
About the numbers
Everything here is measured, not asserted, and the script that measures it lives with the project. The sample is 8,880 days: Apple, Tesla and the S&P 500 fund at 2,000 daily bars each from 20 September 2018, plus Bitcoin, Ethereum and Solana at 1,000 each from 12 December 2023. Crypto is in deliberately — it never closes, which makes it a control rather than a filler.
The claim, under the reading most people take from it: 41 per cent of days have a range of one average or more, and the median day comes in at 0.91 of the average. The 84 per cent is the share of days landing between 0.5 and 1.8 averages — the band the same teaching calls a normal bar. More than two averages: 5.1 per cent of days, against the five it claims, which is a direct hit; the ten per cent for two averages is high, since that band holds about four.
On the recipe: predicting tomorrow's range, a plain five-day average misses by 0.278 average ranges and the same five days with the out-of-band bars excluded misses by 0.277. The exclusion buys nothing. The short window does: fourteen days misses by 0.291 and twenty by 0.298. And the classic indicator measures true range, which includes the overnight gap — 13 per cent larger than high-minus-low on the stocks, identical to three decimals on the crypto pairs.
On the 75 per cent rule: of the 5,953 days that reached three quarters of an average range, the median had 0.35 of an average still to travel and 62 per cent went at least another quarter. The amount remaining flattens — 0.35 after three quarters, 0.33 after a full average, 0.32 after one and a quarter. Daily bars only, six instruments, and this says nothing about where inside a session those ranges were made.
What to do with this
Average the last five daily ranges — highest price minus lowest, no indicator required — and write the number down. That is the scale everything else on your chart is measured in: stop distance, band width, gap size. Then measure the distance from where you would enter to the next level above it, and divide it by your stop. Under six, the setup is not a setup yet, whatever the chart looks like. And late in a day, size the target for about a third of an average range, because that is roughly what is left no matter how far the instrument has already travelled.
Chapters
- 0:00The number every course repeats
- 0:50The measure itself
- 1:38Why you need it
- 2:15The claim
- 2:49An arithmetic problem
- 3:27So where does 80 come from
- 4:08Two sentences that sound alike
- 4:41The shape of the distribution
- 5:20What the usual teaching got right
- 6:06The recipe
- 6:38How far each recipe missed
- 7:17What does work
- 7:57A second reason they disagree
- 8:42The practical claim
- 9:21What the count says
- 9:54The shape, and I did not expect it
- 10:34The table to keep
- 11:10What survives of the rule
- 11:55The second measure
- 12:36Six to eight stops
The calculation
Every number this lesson says out loud comes from the script below. results.txt is what it printed when the video was made.
Full transcript
There is a number every trading course repeats. Eighty per cent of the time, an instrument travels one ATR. One average daily range. The metaphor that comes with it is a car with a full tank: so many miles in it, and when they are used up, the day is done.
I counted eight thousand eight hundred and eighty days across six instruments to see whether that is what happens. The number is real. The sentence attached to it is not, and the gap between them is the difference between four days in ten and eight days in ten. By the end you'll know what the eighty per cent claim really measures, and the one number to write down before an entry.
First the measure itself, because it gets used before it gets defined more often than any other number in trading. Take one daily bar. The highest price it traded, minus the lowest. That is the day's range — how far the thing moved, top to bottom, regardless of where it opened or closed.
Do that for the last several days and average it. That average is the average daily range, and people usually call it the ATR — strictly, the average true range, which also counts overnight gaps. It is the unit this whole channel measures in: stop distance, consolidation width, gap size, all of it.
Why you would want it at all. Because a target has to fit inside what the instrument actually does. If your stop is a dollar and you want three dollars for it, you need three dollars of movement to show up. If the thing you are trading moves four dollars on an average day and you are already halfway through the day, that three is a stretch. If it moves twelve, it is nothing. The number is not a prediction. It is a scale, and without it every other number you write down is unitless.
Now the claim, stated the way it is usually stated. Eighty to eighty-five per cent of the time, the instrument covers one ATR. Two ATR happens about ten per cent of the time, and more than two, about five. Two hundred and fifty trading days in a year, so roughly two hundred and ten of them go one average range. That is precise enough to check, which is the best thing that can be said about any claim.
And it has a problem you can spot before you count anything. The ATR is an average of daily ranges. Daily ranges are lopsided: a few huge days pull the average up, so most days come in below it. Eighty-five per cent of days clearing it would need the opposite shape.
Counted: forty-one per cent of days have a range of one average or more. Not eighty. Forty-one. The median day comes in at nine tenths of the average.
So where does eighty come from? It is in the usual teaching — just not attached to this sentence. The same teaching sets aside bars outside a normal band: a wide-range bar, above about one point eight averages, or one below about half of one. Everything in between is a normal bar.
Count the days that land in that band, between half an average and one point eight: eighty-four per cent. There is the number. It was never about covering one ATR. It is about not being unusual.
Those two sentences sound alike and mean different things. If you believe eight days in ten deliver a full average range, you size targets for it and you are disappointed six days in ten.
What is actually true is that eight days in ten are ordinary — somewhere between half an average and nearly two. That is a much wider spread, and it is a statement about how rarely the market surprises you, not about how far it goes.
Here is the shape those summaries came from. Nine per cent of days come in under half an average. Thirty per cent between half and eight tenths. Thirty-four per cent within twenty per cent either side of the average. Twenty per cent from there up to one point eight. Two per cent between one point eight and two, and five per cent past two. The middle is broad and the tails are thin. That is what a normal-bar band of eighty-four per cent looks like from the inside.
And that five per cent deserves a moment, because the usual teaching called it and got it right. More than two average ranges: five point one per cent of days, against the five it claims. Two hundred and fifty days in a year, so about thirteen of them.
The ten per cent for two ATR is high — the band around two holds four per cent — but the tail beyond two sits exactly where it was said to sit. That is worth saying plainly. The usual teaching is not wrong about everything, and a channel that only reports what fails is running the same selection it complains about.
Next claim, and this one is about method. Do not use the standard ATR indicator, the usual teaching says. It averages every bar including the freak ones, and freaks are rare, so they distort the number. Throw out the bars outside the normal band, average the last five normal ones by hand. That is testable in the only way that matters: whichever recipe comes closest to tomorrow's actual range is the better recipe.
I ran four of them against every day in the sample and measured how far each missed, in average ranges. Plain five-day average: it misses by zero point two seven eight. The usual recipe, the same five days with the out-of-band bars thrown out: zero point two seven seven.
One thousandth. The throwing-out does nothing. Which makes sense once you say it out loud — you are removing the rare bars from a five-day window, and most five-day windows do not contain one.
But something in the recipe does work, and it is the part the usual teaching does not point at. Five days misses by zero point two seven eight. Fourteen days, zero point two nine one. Twenty days, zero point two nine eight.
The shorter average wins. Volatility clusters — a quiet week is followed by a quiet day more often than a three-week average would suggest. The instinct that the standard indicator is worse is correct. The reason is that it is slower, not that it counts freaks.
There is a second reason it disagrees, and it has nothing to do with averaging. The classic indicator measures true range, which includes the gap: if the market opened below yesterday's low, that jump counts as movement. The usual measure is high minus low, and it does not.
On the three stocks, true range is thirteen per cent larger than high minus low on average, and more than ten per cent larger on a quarter of all days. On the three crypto pairs, which never close, the two are identical to three decimal places. The entire difference is gaps.
Now the practical claim, the one that changes what you do. Once the instrument has covered seventy-five per cent of its daily range, the usual teaching says, the chance of it continuing is practically zero. Work against it instead.
The picture behind that is the fuel tank. The day has a range in it, three quarters is spent, so a quarter is left. I can check this on daily bars without any intraday data at all. Take every day that reached three quarters of an average, and ask how much further it actually went.
Of the eight thousand eight hundred and eighty days, five thousand nine hundred and fifty-three reached three quarters of an average range. The median one of those had another zero point three five of an average still to travel. Not the twenty-five you would have left if the tank held exactly one. Thirty-five.
And sixty-two per cent of them went at least another quarter of an average range beyond the point where the chance was supposed to be practically zero.
Then the shape of it, which is the part I did not expect. A day that has covered a quarter of an average has about zero point six six left. At half covered, forty-five. At three quarters, thirty-five. At a full average, thirty-three. At one and a quarter, thirty-two.
It flattens. Past about three quarters, how far the day has already gone stops telling you how much is left. The tank does not empty. Whatever you have watched happen, roughly a third of an average range is still in front of you.
Here is the whole thing as a table, because this is the one to keep. Five rows: how much of an average range the day has already covered, and how much it has left.
Look at the shape rather than the digits. The first two rows fall steeply — a quarter covered leaves two thirds, half covered leaves not quite half. The last three barely move at all. That is not a tank being emptied. That is a process which mostly does not remember what it has already done.
So what survives of the rule, because something does. Not "the odds are zero" — they are not. What is true is that the amount left stops growing. Early in a day, being wrong about direction is survivable because there is room to be right later. Late in a day, whatever your entry, you are working with about a third of an average range, and your target has to fit in it.
That is a real filter, and it is a different filter: not "do not enter", but "your take has to fit in zero point three or so of a daily range, so check that it does".
And this is where the second measure comes in, the one the usual teaching calls technical. The first measure asks how far this thing moves in a day. The second asks how far it can move here — the distance from the level you are entering at to the next level above it. Two numbers, two different questions, and they routinely disagree.
When the room to the next level is much smaller than a daily range, the trade is over before the day is. When it is much larger, the day will not get you there. The disagreement is the information.
Which gives the rule the usual teaching ends on, and only part of it is arithmetic. If your take is three times your stop, and you will not get a perfect entry or a perfect exit, then the room between levels has to hold six to eight stops before the trade is worth taking. Three for the target, and the rest for the fact that you are human — that part is a working margin, not a measurement.
So, the thing to go and do. Take your instrument. Average the last five daily ranges, high minus low, and write the number down. Then measure the distance from where you would enter to the next level, and divide it by your stop. If that second number is under six, the setup is not a setup yet, whatever the chart looks like. Educational content only. Nothing here is financial advice.
Educational content only. Nothing in this video is financial advice, a recommendation to buy or sell, or a promise of any result. Trading involves risk of loss. Do your own research. Risk warning.