The Two Kinds of Room
 Video coming soon on YouTube
Two questions decide whether an entry is worth taking: how far price can go from here, and how much of the day is left. Almost everyone checks one of them.
Miss either and the setup fails for a reason that is never visible on the chart. It does not look like a bad read — it looks like bad luck. Both questions have numbers behind them, and both numbers were measured: 1,987 level crossings across six instruments: eight years of stocks, under three of coins.
What to do with this
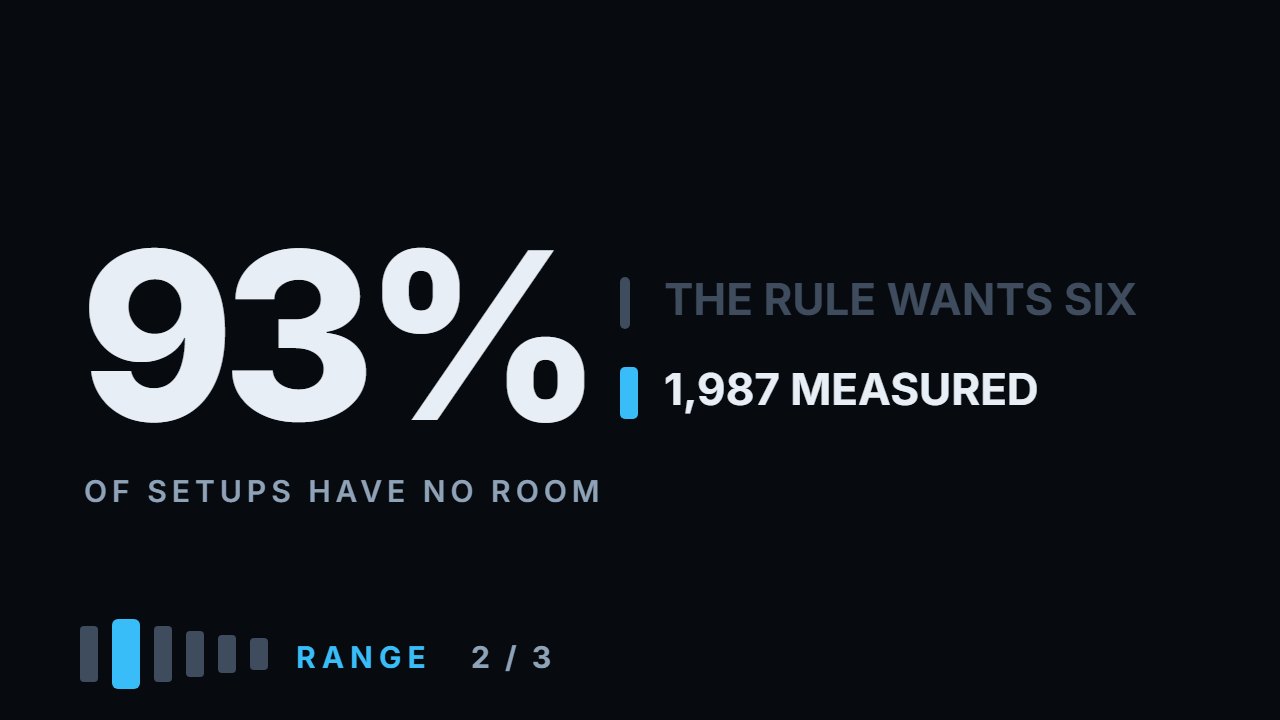
Take one chart and about ten minutes. Mark the nearest level above price and the nearest below. Measure the distance to each, and divide both by your risk — from your entry to a stop a tenth of a daily range past the level. Write the two numbers down. Anything under six is not a setup — on 1,987 measured setups, 93% were — and now you know it before you are in the trade instead of afterwards, which is the only time the number is worth anything.
Chapters
- 0:00The two questions, and the one everybody checks
- 0:37The local extreme, and the name that gets in the way
- 1:11The rule that comes out of it
- 1:51The claim usually attached to it
- 2:25What counts as a turning point
- 3:021,987 crossings, six instruments
- 3:39Not a prediction — the next level being close
- 4:04It is not a special case
- 5:03Apple, on real prices
- 5:41The number that turns it into a filter
- 6:27That is the filter
- 6:51Said downwards, because it is symmetrical
- 7:20What to do when it comes out under six
- 7:52The same chart read the wrong way
- 8:45The second kind of room
- 9:37Across days it fills, both ways
- 10:22The honest limit
- 10:50The two numbers to carry away
- 11:19Go and do this
The calculation
Every number this lesson says out loud comes from the script below. results.txt is what it printed when the video was made.
Full transcript
Two questions decide whether an entry is worth taking, and almost everyone checks one of them. How far can price go from here — the room to the next level. And how much of the day is left — the room in time. Miss either one and the setup fails for a reason that is never visible on the chart. It does not look like a bad read. It looks like bad luck. By the end you'll be able to check, before the trade, whether there is room for it in distance and in time.
Start with the first, because it carries a name that gets in the way. The local trend. It is not a trend. Nothing is trending. It is a position: where price sits relative to the nearest level above it and the nearest below. Above the line you are in one situation, below it in another, and crossing the line moves you from one to the other. That is the entire idea, and the word trend does it no favours.
So the rule that comes out of it is short. Below the level you look for shorts. Above it you look for longs. A long is a bet that price goes up: you buy first and sell higher. A short is the reverse: you sell first and buy back lower. Not because of momentum, and not because of the bigger picture. Because of what is physically in front of you. Buying just under a level means buying with a wall a short distance ahead. You can be completely right about direction and still have nowhere to go.
Here is the claim usually attached to that, and it is a strong one. Once price enters the zone — crosses the line and closes there — it gets pulled to the next level about eighty per cent of the time. Only one time in five does it turn around on the spot. That is precise enough to count, which is the best thing that can be said about any claim. But counting it needs levels defined by a rule, not by eye.
Mine is the plainest rule I could write down. A turning point is a bar whose high is the highest of the five bars on either side of it. Lows the same way, upside down. Wider than the levels module's two-bar turn: fewer, more obvious levels. Crude, and crude on purpose. Any refinement I could add would be a decision about what counts as a level, and that decision is exactly what would let me tune the rule until the answer came out the way I wanted.
One thousand nine hundred and eighty seven crossings. Six instruments: eight years of daily bars on the stocks, under three on the coins. Price reached the next level sixty nine per cent of the time. Not eighty. But close enough that the claim is not invented, and I want to say that before I take it apart.
Then I looked at how long it took, and the number changed meaning underneath me. The median crossing reached the next level in one session. One.
That is not a prediction coming true. That is the next level being close. Measured across the same sample: the median distance from price to the next level above is zero point six five of one daily range. Two thirds of what the instrument travels in an ordinary day. Of course it gets there. It would have to stand still not to.
And it is not a special case, which is the part I did not expect. In sixty four per cent of measurements, the next level is less than one daily range away. So the warning — do not buy into resistance, there is no room — is not describing a trap you occasionally walk into. It is describing the normal state of the chart. Two setups in three. And the shape behind that number is stranger than the number. It is not a hump in the middle. A quarter of all measurements sit under a quarter of a daily range, and another quarter sit above one and a half. Most setups are either almost touching the next level or nowhere near it, and the median of two thirds describes very little of what actually happens.
Here it is on real prices, so it is not a drawing. Apple, the twenty fifth of April last year. Price closes at two hundred and nine twenty eight, just above a turning point at two hundred and eight dollars and forty two cents. It is in the long zone. The rule is satisfied. The next turning point above sits at two hundred and twelve dollars and ninety four cents. Three dollars and sixty six cents away, against an average daily range of nine dollars and fifty six cents. Just over a third of a day.
Now the number that turns all of this into a filter. Put the stop a tenth of a daily range below the level price just crossed, and count your risk from your entry down to it — the stop video later in the course shows why it goes there. Then divide the room to the next level by that risk.
The usual rule says a setup is worth trading when it holds six to eight stops. Measured on one thousand nine hundred and eighty seven real setups — price closing above a level — the median holds less than one stop. Ninety three per cent fail the rule's own test, and it is rarely run.
That is the filter. Not a feeling about resistance, not a rule about trends, not a shape you recognise. One division, done before the entry. Room to the next level, divided by your risk. Under six, the setup is not a setup yet, whatever the chart looks like and however good the story is.
Everything so far has been said upwards, and the rule is symmetrical, so say it downwards once. Below the level you are looking for shorts, and the room that matters is the distance down to the next level under you. Same measurement, same division by your risk. The asymmetry is not in the arithmetic. It is that a level below you is usually easier to see, because price has already been there.
So what do you do when the number comes out under six, which by the count is almost every time. Two things, and neither of them is take it anyway. Wait for price to come back toward the level: your stop stays where it is, past the level, so your risk shrinks and the room grows with every cent it comes back. Or leave the instrument alone and look at another one. The setup does not improve by being wanted.
Now the same Apple chart read the wrong way, because this is the mistake and it is worth watching it made. Everything the first half of this video asks for is satisfied. Price is in the long zone. And the claim holds — over the next three sessions it reached two hundred and thirteen fifty eight, which is past the next level, and then gave it all back and more. The claim was right. The trade was still not worth taking. The stop goes ninety six cents below the level, at two hundred and seven forty six, so the risk from the entry is one dollar eighty two — and three dollars and sixty six cents of room is two stops, where the rule wants six. And the very next session dipped to two hundred and seven forty six, exactly to that stop.
Which brings the second kind of room. A trade has to fit inside the day as well as inside the distance. The usual teaching says it plainly: once the instrument has spent most of its daily range, do not enter. The picture behind it is a fuel tank running down — so many miles in the day, and they get used up.
The video on daily range already measured that one, and the tank does not empty. A day that has covered three quarters of an average range has about a third of one still ahead of it. A day that has covered one and a quarter has about the same third ahead. Past a certain point, what has already happened stops telling you what is left.
Across days it does not merely fail to empty. It fills. After a day that moved less than half an average range, the next day covers about seven tenths of one. Then eight tenths, then almost one, and after a day that moved more than one and a half, one and a quarter. But it fills both ways. After the biggest days, the next one reaches zero point five seven further with the move and zero point five six against it. Bigger, not in a direction. That is the opposite of a tank, and it is measured on the same eight thousand days.
The honest limit, and it matters. Daily bars cannot see the middle of a day, and the usual rule is about the middle of a day. What is measured here is the version across sessions. The version inside one session is measured in the daily-range video. Both come out inverted, and neither is the exact claim usually made. I would rather tell you that than let two numbers stand in for a third.
So, before the task, the two numbers to carry away. Zero point six five of a daily range — the median room to the next level, which is six and a half stops. And a third of a daily range — what is still ahead once the day has covered three quarters of an average range, however far past that it has gone. One tells you whether the trade fits in the distance. The other tells you whether it fits in the time.
And the thing to go and do, which takes one chart and about ten minutes. Mark the nearest level above price and the nearest below. Measure the distance to each, and divide both by your stop. Write the two numbers down. Anything under six is not a setup — and now you know it before you are in the trade instead of afterwards, which is the only time the number is worth anything. Educational content only. Nothing here is financial advice.
Educational content only. Nothing in this video is financial advice, a recommendation to buy or sell, or a promise of any result. Trading involves risk of loss. Do your own research. Risk warning.