Who Actually Moves Price
 Video coming soon on YouTube
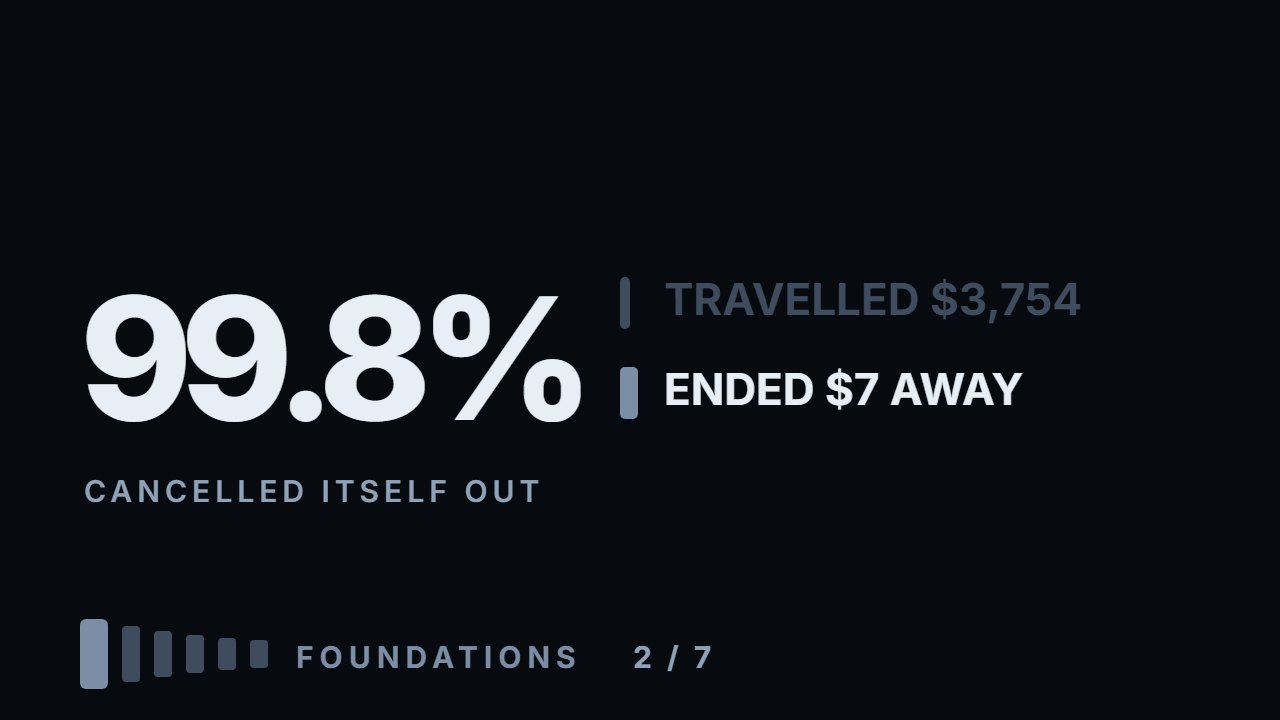
Over 250 sessions Tesla travelled $3,754 and finished $7 from where it started. Ninety nine point eight per cent of everything that happened cancelled itself out.
That number is what a market is. Two sides, broadly balanced, settling over and over — and a thin residue on top that does not arrive evenly. Take away the five best days of the year and Apple keeps less than a third of its gain, while Tesla's $7 turns into a $133 loss. And a third of all movement on that stock happens outside the regular session, when trading is thin and the daily bar does not record it. Everything here is measured: the calculation ships with the video.
What to do with this
Export a year of daily bars for one instrument. Add up high minus low for every day and compare it with the difference between the first close and the last. Then take out the five best days and see what is left of the year.
Chapters
- 0:00Tesla travelled $3,754 and ended $7 away
- 0:56Every trade has two sides
- 1:32So why does price move at all
- 1:54The useful question: who had to act
- 2:13The measurement
- 2:30How much cancels, across six instruments
- 3:21How few days carry the year
- 4:01That one Tesla day, on real prices
- 5:16The strangest number in this video
- 5:40A third of movement, outside the regular session
- 5:59The check built into the measure
- 6:25What happened during those closed hours
- 6:55Who has to act
- 7:44What the rest of the channel builds on
- 8:15Two honest limits
- 8:44What this changes in practice
- 9:34Go and do this
The calculation
Every number this lesson says out loud comes from the script below. results.txt is what it printed when the video was made.
Full transcript
Over the last two hundred and fifty sessions, Tesla travelled three thousand seven hundred and fifty four dollars. High to low, day after day, added up. At the end of it the price was seven dollars from where it started.
Not seven per cent. Seven dollars. Ninety nine point eight per cent of everything that happened cancelled itself out.
That number is the subject of this video, because it tells you what a market actually is and where movement comes from. Both answers are simpler than they sound, and neither is what a beginner assumes.
By the end of this you will know why price stands still most of the time, where the movement that is left comes from, and why a third of it on a stock happens outside the regular session, when trading is thin.
Start with the thing that sounds too obvious to state. Every trade has two sides. Someone bought, someone sold, at the same price, at the same instant.
That is not a figure of speech. It is what a trade is. Your buy did not happen because you wanted it; it happened because someone was willing to sell to you.
So the first thing to give up is the picture of a market as a crowd of buyers pushing price up. For every one of them there was a seller, and they agreed.
Then why does price move at all? One question answers it. For price to change, somebody has to accept a worse price than the one already on offer.
That is the whole mechanism. Price rises because a buyer agreed to pay more than the last one. It falls because a seller agreed to take less.
Which makes the useful question not who is bullish, who expects a rise. It is: who had to act?
Because the person who accepts a worse price is nearly always the person who cannot wait. Everyone else leaves an order and waits for their number.
Now the measurement, because all of that is still just a story until something is counted.
Take the sum of every daily range over two hundred and fifty sessions — the distance price travelled — and compare it with the net change over the same period.
Apple: one thousand four hundred and fifty seven dollars travelled, eighty six dollars of net change. Ninety four per cent cancelled.
The index fund, which holds five hundred large American companies: ninety three per cent. Bitcoin, Ethereum, Solana: between ninety eight and ninety nine. Tesla, the one from the start: ninety nine point eight.
Read that as a statement about the two sides. Almost everything a market does is two groups disagreeing and settling, again and again, and it leaves nothing behind.
So the movement that matters is a thin residue on top of an enormous amount of activity. And the residue does not arrive evenly.
Now take the year and remove its five best days, five out of two hundred and forty nine, and see what is left of the net move.
Apple keeps less than a third of its gain. The index fund, just over a third. Tesla's seven dollars turn into a loss of a hundred and thirty three.
Five days. For Tesla they decided whether the year was a gain at all. And its biggest single day went the other way. A coin flipped with the same daily swings does about the same — that is how small the net move is next to the noise.
Here is that day, on real prices. The twenty third of July. The session before it, Tesla closed at three hundred and seventy four dollars and one cent.
It opened the next morning at three hundred and forty one. Thirty three dollars lower. The regular session was closed; only a thin market after hours and before the open traded across that gap, and the daily bar does not record it.
By the close it was three hundred and nineteen sixty nine. Fifty four dollars down in one day, against seven dollars up for the entire year.
And sixty per cent of that day happened before the opening bell. No crowd of sellers did that. There was no crowd; only a thin market after hours. What there was, was everyone's idea of the right price changing at once, and the market opening where the new willingness met.
That is not a curiosity. It is the shape of the thing you are trading. Most sessions are two sides settling. A few, like that one, are one side having to act.
And here is the part that makes it concrete, because it is the strangest number in this video.
Split every day's movement in two. The part between yesterday's close and today's open — outside the regular session, when trading is thin and most people are not there. And the part between the open and the close, when everyone is.
On Apple, a third of all movement happens outside the regular session. On the index fund, forty five per cent.
Almost half. On the most heavily traded fund in the world, nearly half of the price change arrives while its regular session is closed.
Before you take my word for it, here is the check built into the measurement. Crypto never closes. If the measure were nonsense, it would show something for Bitcoin too.
It shows zero. Zero, zero, and three tenths of a per cent for Solana, which is rounding. The measure knows the difference between a market that closes and one that does not.
So what actually happened during those closed hours? Very little was traded. Something was learned. Earnings, a decision, a number — and the price at which people are willing to deal is no longer yesterday's.
Which is the cleanest possible demonstration of the point. Price is not moved by a crowd of traders. Trading is how a new price gets discovered once the old one is wrong.
Now, who are the people who have to act. There are only a few kinds, and they are worth naming because you will meet all of them.
Someone with borrowed money whose position went against them, and the broker is now closing it whether they agree or not. That is not an opinion arriving in the market. It is an obligation.
A fund that must hold a certain mix and has drifted out of it. A trader whose stop was reached — an instruction that sells at market once price touches a level set in advance — which is the same thing, one size down.
And on the other side of all of them, someone who was waiting, doing nothing, until a price arrived that was worth their while.
That is the picture the rest of this channel builds on. A level, a price where many such orders wait, works because a lot of people have to act at one price, which is the video on what a level is, in the levels module.
A false breakout, price pushing through a level and coming straight back, happens because a pool of forced orders is reached and then exhausted — that is the setups module, and it is the same idea seen from underneath.
Two honest limits. First, none of this says movement is predictable. Knowing that a few days carry the year does not tell you which days.
Second, two hundred and fifty sessions on six instruments: a year for the stocks, eight months for the coins. The pattern is old and well documented, but these particular numbers are this sample, and yours will differ.
What it does change is what you are looking for. Not a crowd of buyers, because there is never a crowd on one side only. Somebody who ran out of choices.
Which turns into something practical the moment you stop waiting for crowds. If most sessions are two sides settling, then most sessions have nothing in them for you, and sitting out is not a failure of discipline. It is the correct response to what the market is doing.
And when you do look for a trade, you are looking for a place where somebody will be out of choices — a price where stops must sit, where positions were built, where an obligation comes due. Not for a place where a lot of people feel bullish.
So, the thing to go and do, and it takes ten minutes with a spreadsheet.
Export a year of daily bars for one instrument. Add up high minus low for every day, and compare it with the difference between the first close and the last. Then take out the five best days and see what is left of the year.
Whatever your numbers are, they will be closer to Tesla's than to what you expected before you counted. And after that, "the market went up today" stops being an explanation. Educational content only. Nothing here is financial advice.
Educational content only. Nothing in this video is financial advice, a recommendation to buy or sell, or a promise of any result. Trading involves risk of loss. Do your own research. Risk warning.