Why a 40% Win Rate Can Still Lose Money
 Video coming soon on YouTube
Your win rate says how often you were right. It says nothing about whether you made money — and most losing accounts have a perfectly ordinary win rate.
This is the arithmetic that decides it, worked on an illustrative trade history, in one line you can run on your own trades tonight.
What to do with this
Export your last 100 trades from your broker or exchange as a CSV. You need four numbers: win rate, loss rate, average win, average loss. Then run the line — win rate times average win, minus loss rate times average loss. If that comes out negative, the fix is almost never the win rate.
Chapters
- 0:00An account that did everything right and lost 20%
- 0:52What win rate actually measures
- 2:07The one line that settles it
- 3:02The win rate you actually need
- 3:55An illustrative trade history, read properly
- 5:48Why win rate is the number everyone chases
- 6:56Where this stops being clean
- 8:34What costs do to the break-even numbers
- 9:44Run it on your own trades
Full transcript
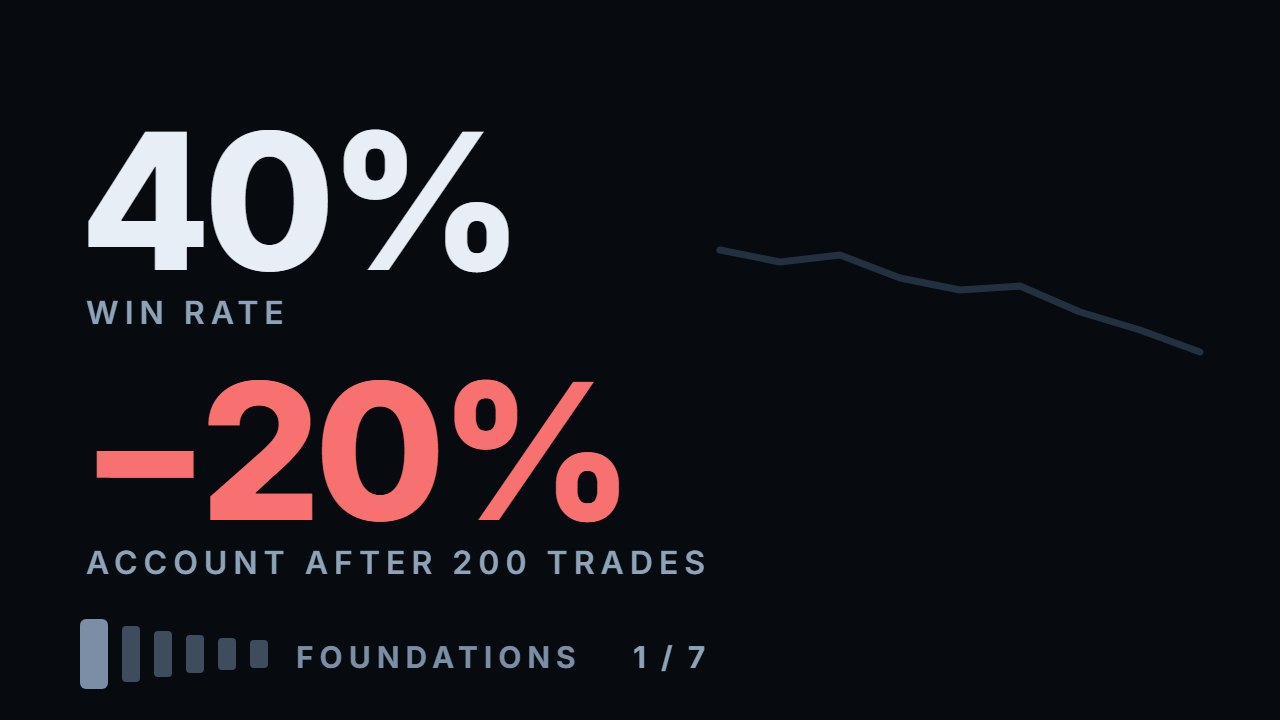
Here is a real problem. An account with two hundred trades on it. Forty percent of those trades were winners. More winning days than losing days. The account is down twenty percent.
Nothing went wrong. No blown stop, no revenge trade, no bad luck. The system did exactly what it was built to do, and it lost money doing it. Win rate is the first number every trader learns to quote. On its own it tells you nothing at all.
In the next ten minutes you'll be able to take your own trade history and work out, in one line of arithmetic, whether it has been making money. Not whether it feels right. Whether the math clears. And when it doesn't, you'll know which of exactly two numbers to fix.
Win rate answers one question: how often you were right. It does not answer the question that pays you, which is how much you were right by.
Two accounts. Both took a hundred trades. Both won exactly forty of them. The first risked one percent per trade and took profit at one percent. Call what you risk on one trade one R. That is what you lose if price reaches your stop — the price you set in advance to get out when you are wrong. Forty winners at one R. Sixty losers at one R. Forty minus sixty. The account is down twenty R. Call it twenty percent.
The second risked the same one percent, and let its winners run to two percent. Forty winners at two R is eighty. Sixty losers at one R is sixty. Eighty minus sixty. Up twenty R.
Same win rate. Same number of losses. Opposite year. The number that separated them was never on the first screen.
There's a single line that settles it. Expectancy per trade equals win rate, times average win, minus loss rate, times average loss. Everything else is commentary.
Run it on the first account. Zero point four times one, minus zero point six times one. Minus zero point two R per trade. Every time that trader clicks the button, they lose a fifth of what they risked. Not sometimes. On average, every time. Second account. Zero point four times two, minus zero point six times one. Plus zero point two R. Same trader. Same win rate. Opposite sign.
Which lets you flip the question around. Instead of asking what win rate is good, ask what win rate you need, given how big your winners are next to your losers. The formula is one, divided by one plus your reward to risk ratio.
At one to one, you need better than fifty percent. At one point five to one, forty percent. At two to one, thirty three. At three to one, twenty five. Read that last one again. At three to one you can be wrong three times out of four and still break even. Most people would call that a terrible strategy. Win one trade in three, and the arithmetic calls it profitable.
Numbers on a slide are easy. Here's what it looks like on a typical trade history — the numbers are illustrative, the shape is common. Six months. A hundred and eighty trades. Twenty five thousand dollars to start. Seventy nine winners, a hundred and one losers. Average win, two hundred and ten dollars. Average loss, two hundred and five. Fifty eight winning days against forty seven losing days.
Look at that account and almost everything reads fine. Win rate in the forties. More winning days than losing days. Average win slightly bigger than average loss.
Run the line. Zero point four four, times two hundred and ten, is ninety two forty. Zero point five six, times two hundred and five, is a hundred and fourteen eighty. Expectancy: minus twenty two dollars and forty cents per trade. Multiply by a hundred and eighty trades. That account is down about four thousand dollars. Sixteen percent.
There is no disaster on that equity curve. One trade stands out, and we'll come back to it, but take it away and the account is still down. It just grinds down, twenty two dollars at a time, while every number on the summary page looks acceptable.
One more figure worth pulling. On that account the largest single loss was eleven hundred and eighty dollars. The largest single win was five hundred and twenty. The averages were nearly equal. The tails were not, and the tails are where accounts actually die.
So why does everyone quote win rate? Because being right feels like the job. A winning trade is proof you read the market correctly. A loser is proof you didn't. Win rate is a scoreboard for that feeling, and it updates immediately.
Here's the expensive part. The behavior that raises your win rate is the same behavior that destroys your expectancy. Take profit early, and more trades close green. Win rate up. Average win down. Move a stop when price goes against you, and fewer trades close red. Win rate up. Average loss bigger.
Do both, and most people do both, because both feel like relief, and you can push a win rate from forty percent to sixty five while the account bleeds out. The scoreboard improves while the business gets worse. That isn't a discipline problem. It's a measurement problem. You're optimizing the number you can see.
Now the part where this stops being clean. Expectancy is a useful number and a badly abused one. It's an average, and averages say nothing about the path. A system with plus zero point two R expectancy will still hand you nine losers in a row. At a forty percent win rate that streak is not rare. It's something you should expect to meet. Expectancy tells you where you end up. It tells you nothing about what you have to sit through on the way.
Small samples lie. Twenty trades is noise. At a forty percent win rate, twenty trades can easily produce twelve winners, or four. Neither means anything. A hundred is the minimum worth reading, and a hundred is still thin.
And this one catches almost everyone. The number is meaningless across a strategy you changed halfway through. If you tightened your stops in March, you don't have two hundred trades. You have two samples of a hundred, and their average describes a system nobody ever traded.
It's also backward looking. A positive expectancy on your last hundred trades is a measurement, not a forecast. Markets change, and the number can turn negative while you're still following the rules that produced it. Which is the argument for recomputing it every fifty trades instead of once.
And one correction to those break even numbers from earlier. They assumed trading is free. It isn't. Every trade pays a spread — the gap between the price you can buy at and the price you can sell at — and a commission. Say that costs a tenth of your risk. Doesn't sound like much. At two to one, break even moves from thirty three percent to about thirty seven. At one to one, from fifty to fifty five.
Costs hit every trade, winners included. But how often you trade doesn't change the win rate you need. What changes it is the size of the cost next to your stop. At two to one, a cost of a tenth of your risk needs about thirty seven percent. Put the same cost on a stop five times tighter, still at two to one, and it's half your risk — the cost is paid per share, and a tighter stop means more shares for the same risk. Now you need fifty.
So, the thing to actually go and do. Export your last hundred trades. Any broker will hand you a CSV. You need four numbers, and only four. One: how many trades were winners, divided by total. That's your win rate. Two: the average size of a winner. Three: the average size of a loser. Four: win rate times average win, minus loss rate times average loss.
No trades yet? Take twenty setups from a chart six months back, write down entry, stop and exit as if you had taken them, and compute the same four numbers. If that last number is positive, you have a candidate, not a verdict — on a hundred trades it can still be noise, and the statistics video shows how much. If it's negative, you now know something more useful than, I need more discipline. You know it's one of two numbers.
And here's the part to be careful about. When expectancy comes back negative, the instinct is to fix the win rate. Take profits sooner, be right more often. That's the lever that feels available. It's also the lever that made the number negative. Look at the other two first. Educational content only. Nothing here is financial advice.
Educational content only. Nothing in this video is financial advice, a recommendation to buy or sell, or a promise of any result. Trading involves risk of loss. Do your own research. Risk warning.