Stocks vs Crypto: What Changes, What Doesn't
 Video coming soon on YouTube
Six instruments — three stocks and three coins — asked the same seven questions. Three answers came back identical. Four came back different, and one of those four is why accounts blow up when somebody moves from one market to the other.
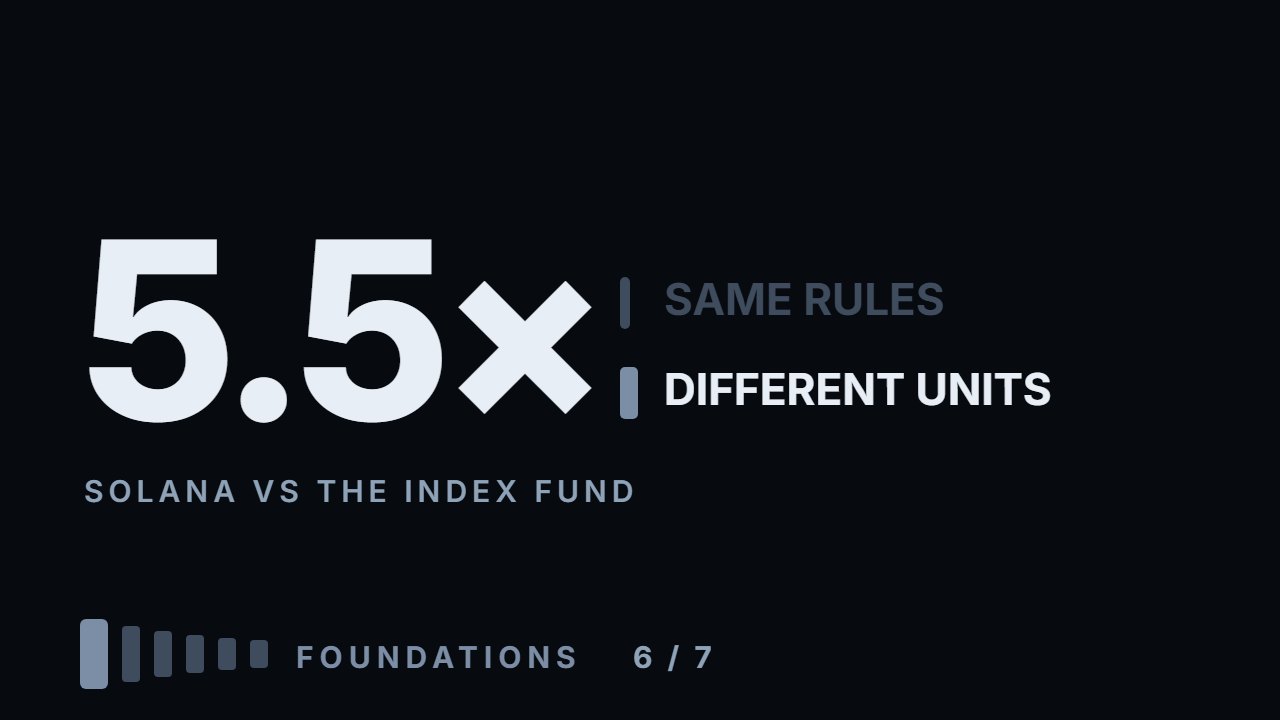
What carries across: the share of movement that cancels itself out (93–99.6% on stocks, 96–97% on crypto), the median body as a share of the daily range (40–49% on all six), and the one reading that survives measurement — bar size, which predicts two to three times the next-day movement on both markets. What does not carry: a typical Solana day is 5.5× a typical index fund day (4.7% of price against 0.85%); a third to 45% of stock movement happens outside the regular session, against zero on crypto; the worst overnight gap was 8.8%, and on crypto there is no overnight at all. One number that is quoted as a law of markets turns out to be a property of a period: the "next day higher" base rate was 52–55% on the stocks and under 50% on all three coins over the same year. Everything here is measured: the calculation ships with the video.
What to do with this
Take the two instruments you are most likely to trade, one from each market if you can. Pull a year of daily bars for both and work out the median of high minus low divided by the close, as a percentage. Divide the bigger by the smaller. That ratio is exactly how much you must shrink your position when you move across — and most people have never calculated it.
Chapters
- 0:00Seven questions, six instruments
- 0:48What does not change: how much cancels
- 1:30The body of a bar, both markets
- 1:56Does bar size predict anything
- 2:47The number that is not a law
- 3:28What a base rate actually means
- 3:44What changes: how far it moves in a day
- 4:27The exchange closes — and crypto doesn't
- 4:53The gap, and why a stop is only a request
- 5:41The other half: crypto has no closing auction
- 6:38How often something enormous happens
- 7:08The mistake: same size, different units
- 8:09The working procedure
- 8:47Three honest limits
- 9:36Go and do this
The calculation
Every number this lesson says out loud comes from the script below. results.txt is what it printed when the video was made.
Full transcript
Six instruments, three stocks and three coins, and the same seven questions asked of all of them. Three answers came back the same. Four came back different, and one of those four is the reason people lose accounts moving from one to the other.
This is the video that decides what this channel is. Not a stock channel, not a crypto channel — a channel about a mechanism that both of them run on.
By the end you will know which parts of your method carry across untouched, which part must be resized every single time, and one number that is not a law of markets at all, though it is usually presented as one.
Start with what does not change, because it is more than people expect.
Question one. How much of the movement cancels itself out. Add up every daily range for a year and compare it with where price actually finished.
Apple: ninety four and a half per cent of it cancelled. The index fund: ninety three. Tesla: ninety nine point six.
Bitcoin: ninety seven. Ethereum: ninety six. Solana: ninety six.
Same answer. Both markets are two sides settling over and over, and the part that stays is thin. Nothing about that depends on what is being traded.
Question two. How much of a day's range is the body — the part between open and close, the part that was not given back.
Stocks: forty four, forty eight, forty nine per cent. Crypto: forty three, forty, forty four.
Forty to forty nine per cent across all six. A bar reports a disagreement the same way in both places.
Question three, and this is the one that matters for method. Does the size of a bar say anything about the next day.
On Apple, after a bar bigger than one and a half times the usual day, the next session moves zero point six five of a daily range. After a quiet bar, zero point two two.
On Bitcoin: zero point five one against zero point two six. On Solana: zero point six six against zero point two.
Two to three times the movement, on both sides. The one reading that survived measurement on stocks survives on crypto too.
So the mechanism carries. Which is the whole argument for learning it once instead of learning two sets of folklore.
Now the number that is not a law, and it is worth stopping on because it is quoted as one.
The base rate. On the stocks, the next day was higher between fifty two and fifty five per cent of the time — the slight upward drift that makes any group look meaningful if you forget to compare against it.
On the three coins, over their last year: forty nine, forty nine point nine, forty eight point two.
Under half. The drift was not there. It is not a property of markets, it is a property of a period, and the period was different.
Which changes how you read every percentage you will ever see, including mine. A number is only meaningful against the base rate of the same market over the same window.
Now what actually changes, and there are four things.
One: how far the thing moves in a day. This has to be measured in per cent of price, because comparing a two hundred dollar share with a hundred thousand dollar coin in dollars tells you nothing.
The index fund moves zero point eight five per cent on a typical day. Apple, one point nine. Tesla, three point four.
Bitcoin, three point zero. Ethereum, four point one. Solana, four point seven.
A typical Solana day is five and a half times a typical day on the index fund. Same chart, same candles, entirely different distance.
Two: the regular session closes. On Apple, a third of all movement happens outside it. On the index fund, forty five per cent.
On the three coins, zero. The market never closes, so there is no outside to move in.
That sounds like an advantage for crypto, and in one narrow sense it is. Here is what it actually buys you.
Three: the gap. The worst overnight jump in the year was eight point six per cent on Apple and eight point eight on Tesla. On the coins, zero — there is no overnight.
A gap is the clearest case of a stop that is not a stop. Your order sits at a price, the exchange opens somewhere else, and you are filled where the market opened, not where you asked.
So on stocks, a gap can jump straight past your stop. On crypto there is no overnight gap, but a fast move or a thin market can still fill a stop far from its number. One cause fewer, not a guarantee.
There is a second half to that, and it cuts the other way. On a stock, the closing price comes out of an auction: everyone who has to be positioned by the bell takes whatever it clears at.
Crypto has no bell. The daily close is whatever the price happened to be at midnight, on a boundary somebody chose. It is a slice of a continuous tape, not an event.
So a rule written on daily closes stands on firmer ground on a stock than on a coin. It still works — but on crypto the close is one price among many, and the level it marks is softer.
The calendar differs too. A stock has two days a week when nothing trades and news keeps arriving, and the whole weekend lands at once on Monday's open. On crypto the weekend is simply quieter.
Four: how often something enormous happens. Days where price changed by more than ten per cent.
Apple and the index fund: none in the year. Tesla: one day. Bitcoin: two. Ethereum: seven. Solana: eight.
And crypto trades three hundred and sixty five days a year against two hundred and fifty one, so there is more calendar for those days to land in.
Put the four together and you get the mistake, which is almost always the same mistake.
Somebody trades stocks with a position size that feels normal. They move to crypto, keep the size, and keep the stop at the same fraction of the daily range, because that is the rule.
But on Solana the daily range is two and a half times Apple's. The stop is two and a half times further away. Same size, same rule, two and a half times the loss.
Nothing was broken. The rule held. The number the rule was measured in changed, and nobody re-measured.
Which is the actual answer to the question this video asks. What carries is the method. What does not carry is any number expressed in the units of the other market.
Rules transfer. Sizes do not.
So the working procedure is short. Measure the instrument's typical daily range in per cent. Set your stop in those units, not in dollars and not in habit.
Then size the position so that the stop, wherever it lands, costs the same fraction of the account it always costs. That is the risk module, and it is the same arithmetic on both markets.
And check the base rate of the market you are actually in, over the window you are actually trading, before believing any percentage — including the ones in this video.
Three honest limits.
One: the crypto series here starts in late 2023, so the two markets do not cover identical history. The comparisons are within one shared calendar year; the longer stock record is not being smuggled in.
Two: three instruments a side is enough to show a difference — against Apple, from one point six to two and a half times. It is not enough to pin that ratio to a decimal, and it moves with the period.
Three: this is spot — buying the share or the coin itself, with your own money. Leverage does not change any of these numbers; it changes what they cost you, and it is the next video in this module.
So, what to go and do, and it takes about fifteen minutes.
Take the two instruments you are most likely to trade — one from each market if you can. Pull a year of daily bars for both. For each, work out the median of high minus low, divided by the close, as a percentage.
Then divide the bigger by the smaller. That ratio is exactly how much you must shrink your position when you move across, and most people have never calculated it.
The mechanism is one thing. The units are not. Educational content only. Nothing here is financial advice.
Educational content only. Nothing in this video is financial advice, a recommendation to buy or sell, or a promise of any result. Trading involves risk of loss. Do your own research. Risk warning.